- Page 1 and 2: ON THE EFFECTS OF CIRCULAR BOLT PAT
- Page 3 and 4: ACKNOWLEDGMENTS I would like to exp
- Page 5 and 6: elements during monotonic and cycli
- Page 7 and 8: 3.2.3.1.2 Surface Preparation .....
- Page 9 and 10: APPENDIX ..........................
- Page 11 and 12: 3-15 Configuration Of Extended End-
- Page 13 and 14: 5-10 Comparison Of The Predicted Vs
- Page 15 and 16: 6-18 End-Plate Deformation Of (a) T
- Page 17 and 18: 6-4 Energy Dissipation Percentage V
- Page 19 and 20: (a) (b) (c) . Figure 1-1 Failure Mo
- Page 21 and 22: noticeable. Among those, Asteneh-as
- Page 23 and 24: phenomenon will decrease the bolt-f
- Page 25 and 26: Douty and McGuire [3] (1965) conduc
- Page 27 and 28: Tsai and Popov [33] performed three
- Page 29 and 30: plate moment connection can be use
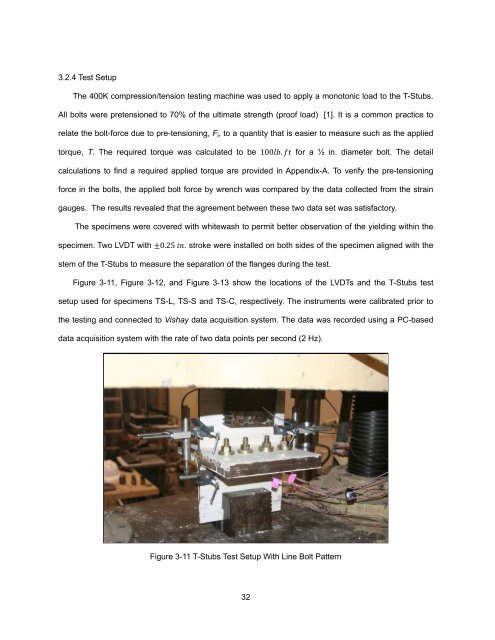
- Page 31 and 32: during moderate earthquake excitati
- Page 33 and 34: Gebbeken et al.[56] used the finite
- Page 35 and 36: load overcomes the pretension force
- Page 37 and 38: Figure 2-3 Tension Angle Free-Body
- Page 39 and 40: CHAPTER 3 3. EXPERIMENTAL INVESTIGA
- Page 41 and 42: compared with results collected fro
- Page 43 and 44: Figure 3-5 Deformed Shape Of The T-
- Page 45 and 46: head. Two varnished copper wires we
- Page 47: Figure 3-8 Schematic Drawing Of The
- Page 51 and 52: The instrumented bolts were connect
- Page 53 and 54: Figure 3-14 Applied Force Vs. Flang
- Page 55 and 56: describing the configuration of the
- Page 57 and 58: column flange by one row of ¾ in.
- Page 59 and 60: prevent out-of-plane buckling of th
- Page 61 and 62: Figure 3-20(c) shows the test instr
- Page 63 and 64: Element Washer Bolt Line Number Tab
- Page 65 and 66: modulus and the rate at which the h
- Page 67 and 68: (a) (b) (c) Figure 4-3 Contacts In
- Page 69 and 70: Bolt Force (kip) 0 2 4 (mm) 6 8 Fig
- Page 71 and 72: It can be seen from the results pre
- Page 73 and 74: a very early stage of loading with
- Page 75 and 76: Moment (kip.ft) 300 200 100 0 -100
- Page 77 and 78: Figure 4-17 Failure Of Bolts In The
- Page 79 and 80: geometrical configuration of bolt h
- Page 81 and 82: Figure 4-23 Failure Of The Angle Du
- Page 83 and 84: CHAPTER 5 5. DEVELOPMENT OF HYSTERE
- Page 85 and 86: The schematic comparison of the pro
- Page 87 and 88: Bolt-4 Bolt-5 Bolt-3 End-Plate Bolt
- Page 89 and 90: The analyses were conducted by appl
- Page 91 and 92: Figure 5-5 Schematic Drawing Of The
- Page 93 and 94: F G Figure 5-6 Tri-Linear Hysteresi
- Page 95 and 96: simulate the hysteresis characteris
- Page 97: Table 5-5 Continued 80
- Page 104:
Table 5-7 Summary Of The Results An
- Page 109 and 110:
Section 5-6-3-4 Figure 5-7 Section
- Page 111 and 112:
These techniques yield information
- Page 113 and 114:
2 A value of R 1 implies that S is
- Page 115 and 116:
(kip.ft) Figure 5-9 Comparison Of T
- Page 117 and 118:
M e . .t . .A . .S . (5-17) The p
- Page 119 and 120:
Figure 5-16 Comparison Of The Predi
- Page 121 and 122:
(ksi) Figure 5-19 Comparison Of The
- Page 123 and 124:
(ksi) Figure 5-22 Comparison Of The
- Page 125 and 126:
CHAPTER 6 6. DISCUSSION OF THE RESU
- Page 127 and 128:
Table 6-2 Energy Dissipation Percen
- Page 129 and 130:
espectively. While in similar model
- Page 131 and 132:
Moment (kip.ft) 900 450 0 ‐450
- Page 133 and 134:
Models Tp1½-Bd½-d30, Tp1-Bd½-d30
- Page 135 and 136:
a) Tp½-Bd1¼-d30-CIR 140 Bolt Forc
- Page 137 and 138:
a) Tp1½-Bd1¼-d30-CIR 140 Bolt For
- Page 139 and 140:
a) Tp1½-Bd½-d30-CIR 25 Bolt Force
- Page 141 and 142:
This phenomenon is attributed to th
- Page 143 and 144:
6.5 Bolt-Force Variation Under Cycl
- Page 145 and 146:
a) Tp1.0-Bd1¼-d30- 140 Bolt Force
- Page 147 and 148:
a) Tp½-Bd½-d30- 25 Bolt Force (ki
- Page 149 and 150:
a) Tp¾-Bd¾-d30- 60 Bolt Force (ki
- Page 151 and 152:
configurations of the finite elemen
- Page 153 and 154:
Circular Bolt Pattern Square Bolt P
- Page 155 and 156:
0.15 0.3 0.45 0.6 0.75 (a) (b) Figu
- Page 157 and 158:
initial stiffness of the connection
- Page 159 and 160:
parameters is recommended to study
- Page 161 and 162:
The relation between applied torque
- Page 163 and 164:
146 Table B-1 Test Matrix of the Co
- Page 165 and 166:
Table B-3Test Matrix of the Connect
- Page 167 and 168:
The hysteresis results obtained fro
- Page 169 and 170:
Moment (kip.ft) 1500 1000 500 0 -2%
- Page 171 and 172:
Moment (kip.ft) 1500 1000 500 0 ‐
- Page 173 and 174:
Moment (kip.ft) 1500 1000 500 0 ‐
- Page 175 and 176:
Moment (kip.ft) Figure C-22 Compari
- Page 177 and 178:
Moment (kip.ft) ‐2% ‐1% 0% 1% 2
- Page 179 and 180:
Moment (kip.ft) Figure C-34 Compari
- Page 181 and 182:
Moment (kip.ft) Figure C-40 Compari
- Page 183 and 184:
Moment (kip.ft) ‐1.5% ‐1.0% ‐
- Page 185 and 186:
Moment (kip.ft) ‐1.5% ‐1.0% ‐
- Page 187 and 188:
Moment (kip.ft) ‐1.5% ‐1.0% ‐
- Page 189 and 190:
Moment (kip.ft) 1000 750 500 250 0
- Page 191 and 192:
Moment (kip.ft) Figure C-70 Compari
- Page 193 and 194:
Moment (kip.ft) Figure C-75 Compari
- Page 195 and 196:
Moment (kip.ft) 2000 1500 1000 500
- Page 197 and 198:
Moment (kip.ft) Figure C-86 Compari
- Page 199 and 200:
Moment (kip.ft) 1500 1000 500 0 ‐
- Page 201 and 202:
The hysteresis results obtained fro
- Page 203 and 204:
Moment (kip.ft) 2000 1500 1000 500
- Page 205 and 206:
Moment (kip.ft) -2% -1% 0% 1% 2% -5
- Page 207 and 208:
Moment (kip.ft) -2% -1% 0% 1% 2% -5
- Page 209 and 210:
Moment (kip.ft) -2% -1% 0% 1% 2% -5
- Page 211 and 212:
Moment (kip.ft) -2% -1% 0% 1% 2% -5
- Page 213 and 214:
Moment (kip.ft) Figure D-34 Compari
- Page 215 and 216:
Moment (kip.ft) 900 600 300 0 -2% -
- Page 217 and 218:
Moment (kip.ft) ‐1.5% ‐1.0% ‐
- Page 219 and 220:
Moment (kip.ft) ‐1.5% ‐1.0% ‐
- Page 221 and 222:
Moment (kip.ft) Figure D-58 Compari
- Page 223 and 224:
Moment (kip.ft) Figure D-64 Compari
- Page 225 and 226:
Moment (kip.ft) ‐1.5% ‐1.0% ‐
- Page 227 and 228:
Moment (kip.ft) ‐1.5% ‐1.0% ‐
- Page 229 and 230:
Moment (kip.ft) 1500 1000 500 0 ‐
- Page 231 and 232:
Moment (kip.ft) 1500 1000 500 0 ‐
- Page 233 and 234:
The simulated tri-linear hysteresis
- Page 235 and 236:
Moment (kip.ft) 1500 1000 500 0 -2%
- Page 237 and 238:
Moment (kip.ft) -2% -1% 0% 1% 2% -5
- Page 239 and 240:
Moment (kip.ft) 1500 1000 500 0 -2%
- Page 241 and 242:
Moment (kip.ft) -2% -1% 0% 1% 2% -5
- Page 243 and 244:
Moment (kip.ft) -2% -1% 0% 1% 2% -5
- Page 245 and 246:
Moment (kip.ft) Figure E-34 Compari
- Page 247 and 248:
Moment (kip.ft) 900 600 300 0 -2% -
- Page 249 and 250:
Moment (kip.ft) -2% -1% 0% 1% 2% -5
- Page 251 and 252:
Moment (kip.ft) -2% -1% 0% 1% 2% -5
- Page 253 and 254:
Moment (kip.ft) Figure E-58 Compari
- Page 255 and 256:
Moment (kip.ft) -2% -1% 0% 1% 2% -2
- Page 257 and 258:
Moment (kip.ft) -2% -1% 0% 1% 2% -6
- Page 259 and 260:
Moment (kip.ft) 2000 1500 1000 500
- Page 261 and 262:
Moment (kip.ft) -2% -1% 0% 1% 2% -5
- Page 263 and 264:
The statistical parameters used dur
- Page 265 and 266:
248
- Page 267 and 268:
250
- Page 269 and 270:
252
- Page 271 and 272:
254
- Page 273 and 274:
256
- Page 275 and 276:
258
- Page 277 and 278:
260
- Page 279 and 280:
262
- Page 281 and 282:
[11] Morrison, S. J., Astaneh-Asl,
- Page 283 and 284:
[33] Tsai K. C., Popov E. P. (1990)
- Page 285 and 286:
[56] Gebbeken, N., Rothert, H., and
- Page 287:
BIOGRAGHICAL INFORMATION Roozbeh Ki