wcms_161662
wcms_161662
wcms_161662

Create successful ePaper yourself
Turn your PDF publications into a flip-book with our unique Google optimized e-Paper software.
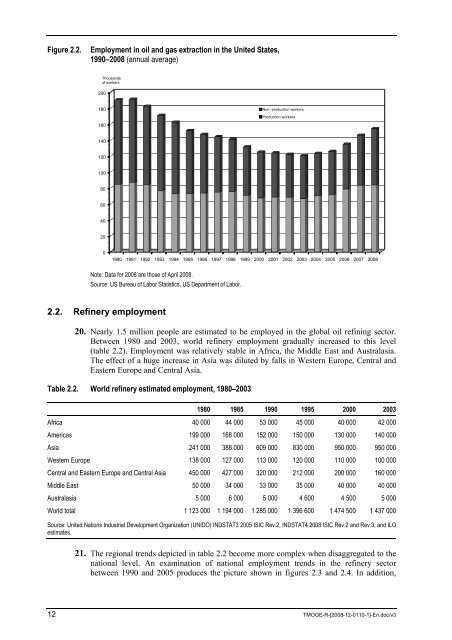
Figure 2.2. Employment in oil and gas extraction in the United States,<br />
1990–2008 (annual average)<br />
Thousands<br />
of workers<br />
200<br />
180<br />
160<br />
140<br />
120<br />
100<br />
80<br />
60<br />
40<br />
20<br />
0<br />
Note: Data for 2008 are those of April 2008.<br />
Source: US Bureau of Labor Statistics, US Department of Labor.<br />
2.2. Refinery employment<br />
20. Nearly 1.5 million people are estimated to be employed in the global oil refining sector.<br />
Between 1980 and 2003, world refinery employment gradually increased to this level<br />
(table 2.2). Employment was relatively stable in Africa, the Middle East and Australasia.<br />
The effect of a huge increase in Asia was diluted by falls in Western Europe, Central and<br />
Eastern Europe and Central Asia.<br />
Table 2.2. World refinery estimated employment, 1980–2003<br />
Non -production workers<br />
Production workers<br />
1990 1991 1992 1993 1994 1995 1996 1997 1998 1999 2000 2001 2002 2003 2004 2005 2006 2007 2008<br />
1980 1985 1990 1995 2000 2003<br />
Africa 40 000 44 000 53 000 45 000 40 000 42 000<br />
Americas 199 000 168 000 152 000 150 000 130 000 140 000<br />
Asia 241 000 388 000 609 000 830 000 950 000 950 000<br />
Western Europe 138 000 127 000 113 000 120 000 110 000 100 000<br />
Central and Eastern Europe and Central Asia 450 000 427 000 320 000 212 000 200 000 160 000<br />
Middle East 50 000 34 000 33 000 35 000 40 000 40 000<br />
Australasia 5 000 6 000 5 000 4 600 4 500 5 000<br />
World total 1 123 000 1 194 000 1 285 000 1 396 600 1 474 500 1 437 000<br />
Source: United Nations Industrial Development Organization (UNIDO) INDSTAT3 2005 ISIC Rev.2, INDSTAT4 2008 ISIC Rev.2 and Rev.3, and ILO<br />
estimates.<br />
21. The regional trends depicted in table 2.2 become more complex when disaggregated to the<br />
national level. An examination of national employment trends in the refinery sector<br />
between 1990 and 2005 produces the picture shown in figures 2.3 and 2.4. In addition,<br />
12 TMOGE-R-[2008-12-0110-1]-En.doc/v3