wcms_161662
wcms_161662
wcms_161662

Create successful ePaper yourself
Turn your PDF publications into a flip-book with our unique Google optimized e-Paper software.
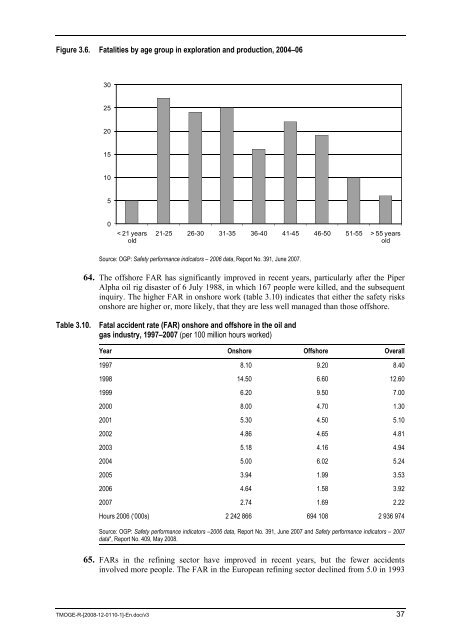
Figure 3.6. Fatalities by age group in exploration and production, 2004–06<br />
30<br />
25<br />
20<br />
15<br />
10<br />
5<br />
0<br />
< 21 years<br />
old<br />
21-25 26-30 31-35 36-40 41-45 46-50 51-55 > 55 years<br />
old<br />
Source: OGP: Safety performance indicators – 2006 data, Report No. 391, June 2007.<br />
64. The offshore FAR has significantly improved in recent years, particularly after the Piper<br />
Alpha oil rig disaster of 6 July 1988, in which 167 people were killed, and the subsequent<br />
inquiry. The higher FAR in onshore work (table 3.10) indicates that either the safety risks<br />
onshore are higher or, more likely, that they are less well managed than those offshore.<br />
Table 3.10. Fatal accident rate (FAR) onshore and offshore in the oil and<br />
gas industry, 1997–2007 (per 100 million hours worked)<br />
Year Onshore Offshore Overall<br />
1997 8.10 9.20 8.40<br />
1998 14.50 6.60 12.60<br />
1999 6.20 9.50 7.00<br />
2000 8.00 4.70 1.30<br />
2001 5.30 4.50 5.10<br />
2002 4.86 4.65 4.81<br />
2003 5.18 4.16 4.94<br />
2004 5.00 6.02 5.24<br />
2005 3.94 1.99 3.53<br />
2006 4.64 1.58 3.92<br />
2007 2.74 1.69 2.22<br />
Hours 2006 (‘000s) 2 242 866 694 108 2 936 974<br />
Source: OGP: Safety performance indicators –2006 data, Report No. 391, June 2007 and Safety performance indicators – 2007<br />
data", Report No. 409, May 2008.<br />
65. FARs in the refining sector have improved in recent years, but the fewer accidents<br />
involved more people. The FAR in the European refining sector declined from 5.0 in 1993<br />
TMOGE-R-[2008-12-0110-1]-En.doc/v3 37