wcms_161662
wcms_161662
wcms_161662

Create successful ePaper yourself
Turn your PDF publications into a flip-book with our unique Google optimized e-Paper software.
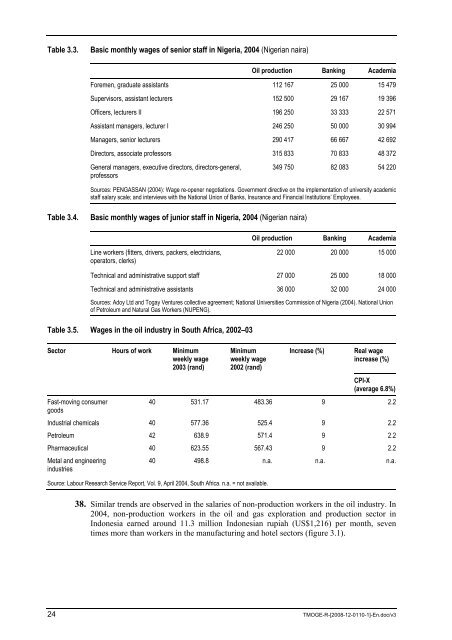
Table 3.3. Basic monthly wages of senior staff in Nigeria, 2004 (Nigerian naira)<br />
Oil production Banking Academia<br />
Foremen, graduate assistants 112 167 25 000 15 479<br />
Supervisors, assistant lecturers 152 500 29 167 19 396<br />
Officers, lecturers II 196 250 33 333 22 571<br />
Assistant managers, lecturer I 246 250 50 000 30 994<br />
Managers, senior lecturers 290 417 66 667 42 692<br />
Directors, associate professors 315 833 70 833 48 372<br />
General managers, executive directors, directors-general,<br />
professors<br />
349 750 82 083 54 220<br />
Sources: PENGASSAN (2004): Wage re-opener negotiations. Government directive on the implementation of university academic<br />
staff salary scale; and interviews with the National Union of Banks, Insurance and Financial Institutions’ Employees.<br />
Table 3.4. Basic monthly wages of junior staff in Nigeria, 2004 (Nigerian naira)<br />
Line workers (fitters, drivers, packers, electricians,<br />
operators, clerks)<br />
Oil production Banking Academia<br />
22 000 20 000 15 000<br />
Technical and administrative support staff 27 000 25 000 18 000<br />
Technical and administrative assistants 36 000 32 000 24 000<br />
Sources: Adoy Ltd and Togay Ventures collective agreement; National Universities Commission of Nigeria (2004). National Union<br />
of Petroleum and Natural Gas Workers (NUPENG).<br />
Table 3.5. Wages in the oil industry in South Africa, 2002–03<br />
Sector Hours of work Minimum<br />
weekly wage<br />
2003 (rand)<br />
Fast-moving consumer<br />
goods<br />
Minimum<br />
weekly wage<br />
2002 (rand)<br />
Increase (%) Real wage<br />
increase (%)<br />
CPI-X<br />
(average 6.8%)<br />
40 531.17 483.36 9 2.2<br />
Industrial chemicals 40 577.36 525.4 9 2.2<br />
Petroleum 42 638.9 571.4 9 2.2<br />
Pharmaceutical 40 623.55 567.43 9 2.2<br />
Metal and engineering<br />
industries<br />
40 498.8 n.a. n.a. n.a.<br />
Source: Labour Research Service Report, Vol. 9, April 2004, South Africa. n.a. = not available.<br />
38. Similar trends are observed in the salaries of non-production workers in the oil industry. In<br />
2004, non-production workers in the oil and gas exploration and production sector in<br />
Indonesia earned around 11.3 million Indonesian rupiah (US$1,216) per month, seven<br />
times more than workers in the manufacturing and hotel sectors (figure 3.1).<br />
24 TMOGE-R-[2008-12-0110-1]-En.doc/v3