wcms_161662
wcms_161662
wcms_161662

You also want an ePaper? Increase the reach of your titles
YUMPU automatically turns print PDFs into web optimized ePapers that Google loves.
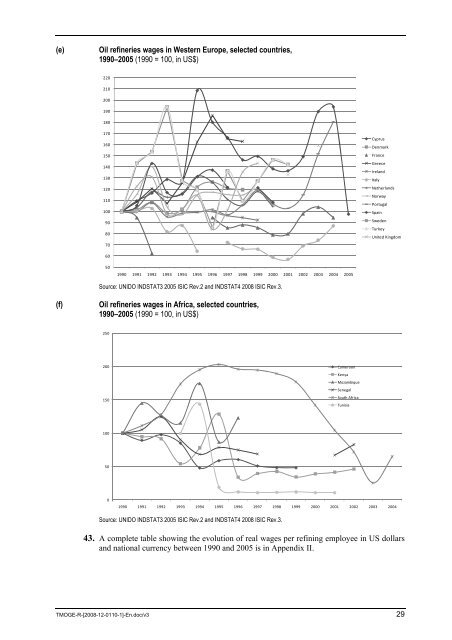
(e) Oil refineries wages in Western Europe, selected countries,<br />
1990–2005 (1990 = 100, in US$)<br />
220<br />
210<br />
200<br />
190<br />
180<br />
170<br />
160<br />
150<br />
140<br />
130<br />
120<br />
110<br />
100<br />
90<br />
80<br />
70<br />
60<br />
50<br />
1990 1991 1992 1993 1994 1995 1996 1997 1998 1999 2000 2001 2002 2003 2004 2005<br />
Source: UNIDO INDSTAT3 2005 ISIC Rev.2 and INDSTAT4 2008 ISIC Rev.3.<br />
(f) Oil refineries wages in Africa, selected countries,<br />
1990–2005 (1990 = 100, in US$)<br />
250<br />
200<br />
150<br />
100<br />
50<br />
0<br />
Cameroon<br />
TMOGE-R-[2008-12-0110-1]-En.doc/v3 29<br />
Cyprus<br />
Denmark<br />
France<br />
Greece<br />
Ireland<br />
Italy<br />
Netherlands<br />
Norway<br />
Portugal<br />
Spain<br />
Sweden<br />
Turkey<br />
United Kingdom<br />
1990 1991 1992 1993 1994 1995 1996 1997 1998 1999 2000 2001 2002 2003 2004<br />
Source: UNIDO INDSTAT3 2005 ISIC Rev.2 and INDSTAT4 2008 ISIC Rev.3.<br />
Kenya<br />
Mozambique<br />
Senegal<br />
South Africa<br />
43. A complete table showing the evolution of real wages per refining employee in US dollars<br />
and national currency between 1990 and 2005 is in Appendix II.<br />
Tunisia