wcms_161662
wcms_161662
wcms_161662

Create successful ePaper yourself
Turn your PDF publications into a flip-book with our unique Google optimized e-Paper software.
No. of accidents Injury classification<br />
Accidents Fatalities Engine<br />
related<br />
Injuries Severity<br />
Passengers Crew Injured Fatal<br />
2004 total 20 7 4 34 15 23 26<br />
2003 total 35 13 6 70 23 41 52<br />
2002 total 25 6 9 16 13 10 19<br />
Source: OGP: "Safety performance of helicopter operations in the oil and gas industry – 2006 data", Report No. 402, Nov. 2007.<br />
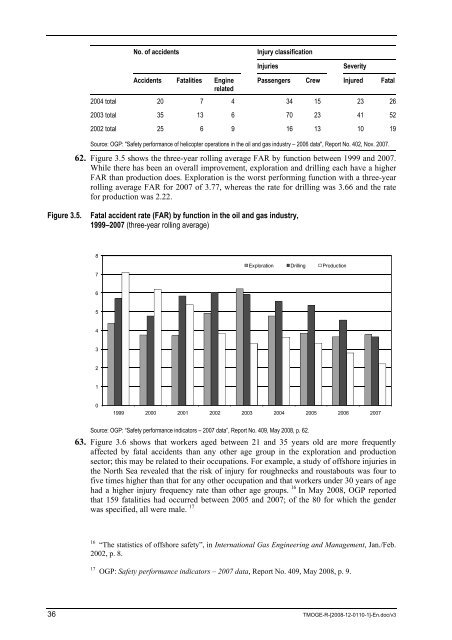
62. Figure 3.5 shows the three-year rolling average FAR by function between 1999 and 2007.<br />
While there has been an overall improvement, exploration and drilling each have a higher<br />
FAR than production does. Exploration is the worst performing function with a three-year<br />
rolling average FAR for 2007 of 3.77, whereas the rate for drilling was 3.66 and the rate<br />
for production was 2.22.<br />
Figure 3.5. Fatal accident rate (FAR) by function in the oil and gas industry,<br />
1999–2007 (three-year rolling average)<br />
8<br />
7<br />
6<br />
5<br />
4<br />
3<br />
2<br />
1<br />
0<br />
Exploration Drilling Production<br />
1999 2000 2001 2002 2003 2004 2005 2006 2007<br />
Source: OGP: “Safety performance indicators – 2007 data”, Report No. 409, May 2008, p. 62.<br />
63. Figure 3.6 shows that workers aged between 21 and 35 years old are more frequently<br />
affected by fatal accidents than any other age group in the exploration and production<br />
sector; this may be related to their occupations. For example, a study of offshore injuries in<br />
the North Sea revealed that the risk of injury for roughnecks and roustabouts was four to<br />
five times higher than that for any other occupation and that workers under 30 years of age<br />
had a higher injury frequency rate than other age groups. 16 In May 2008, OGP reported<br />
that 159 fatalities had occurred between 2005 and 2007; of the 80 for which the gender<br />
was specified, all were male. 17<br />
16<br />
“The statistics of offshore safety”, in International Gas Engineering and Management, Jan./Feb.<br />
2002, p. 8.<br />
17 OGP: Safety performance indicators – 2007 data, Report No. 409, May 2008, p. 9.<br />
36 TMOGE-R-[2008-12-0110-1]-En.doc/v3