Marketed Surplus and Post-harvest Losses of Jowar - Agmarknet
Marketed Surplus and Post-harvest Losses of Jowar - Agmarknet
Marketed Surplus and Post-harvest Losses of Jowar - Agmarknet

Create successful ePaper yourself
Turn your PDF publications into a flip-book with our unique Google optimized e-Paper software.
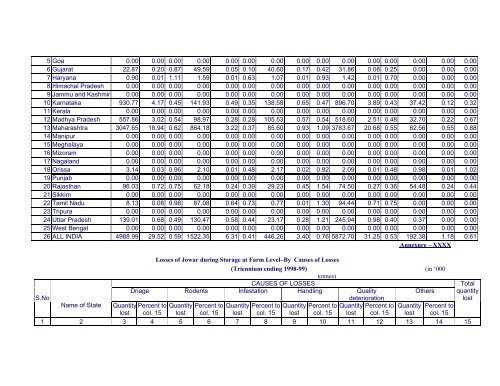
5 Goa 0.00 0.00 0.00 0.00 0.00 0.00 0.00 0.00 0.00 0.00 0.00 0.00 0.00 0.00 0.00<br />
6 Gujarat 22.87 0.20 0.87 49.59 0.05 0.10 40.60 0.17 0.42 31.86 0.08 0.25 0.00 0.00 0.00<br />
7 Haryana 0.90 0.01 1.11 1.59 0.01 0.63 1.07 0.01 0.93 1.42 0.01 0.70 0.00 0.00 0.00<br />
8 Himachal Pradesh 0.00 0.00 0.00 0.00 0.00 0.00 0.00 0.00 0.00 0.00 0.00 0.00 0.00 0.00 0.00<br />
9 Jammu <strong>and</strong> Kashmir 0.00 0.00 0.00 0.00 0.00 0.00 0.00 0.00 0.00 0.00 0.00 0.00 0.00 0.00 0.00<br />
10 Karnataka 930.77 4.17 0.45 141.93 0.49 0.35 138.58 0.65 0.47 896.70 3.89 0.43 37.42 0.12 0.32<br />
11 Kerala 0.00 0.00 0.00 0.00 0.00 0.00 0.00 0.00 0.00 0.00 0.00 0.00 0.00 0.00 0.00<br />
12 Madhya Pradesh 557.86 3.02 0.54 98.97 0.28 0.28 105.53 0.57 0.54 518.60 2.51 0.48 32.70 0.22 0.67<br />
13 Maharashtra 3047.65 18.94 0.62 864.18 3.22 0.37 85.60 0.93 1.09 3763.67 20.68 0.55 62.56 0.55 0.88<br />
14 Manipur 0.00 0.00 0.00 0.00 0.00 0.00 0.00 0.00 0.00 0.00 0.00 0.00 0.00 0.00 0.00<br />
15 Meghalaya 0.00 0.00 0.00 0.00 0.00 0.00 0.00 0.00 0.00 0.00 0.00 0.00 0.00 0.00 0.00<br />
16 Mizoram 0.00 0.00 0.00 0.00 0.00 0.00 0.00 0.00 0.00 0.00 0.00 0.00 0.00 0.00 0.00<br />
17 Nagal<strong>and</strong> 0.00 0.00 0.00 0.00 0.00 0.00 0.00 0.00 0.00 0.00 0.00 0.00 0.00 0.00 0.00<br />
18 Orissa 3.14 0.03 0.96 2.10 0.01 0.48 2.17 0.02 0.92 2.09 0.01 0.48 0.98 0.01 1.02<br />
19 Punjab 0.00 0.00 0.00 0.00 0.00 0.00 0.00 0.00 0.00 0.00 0.00 0.00 0.00 0.00 0.00<br />
20 Rajasthan 96.03 0.72 0.75 62.18 0.24 0.39 29.23 0.45 1.54 74.50 0.27 0.36 54.48 0.24 0.44<br />
21 Sikkim 0.00 0.00 0.00 0.00 0.00 0.00 0.00 0.00 0.00 0.00 0.00 0.00 0.00 0.00 0.00<br />
22 Tamil Nadu 8.13 0.08 0.98 87.08 0.64 0.73 0.77 0.01 1.30 94.44 0.71 0.75 0.00 0.00 0.00<br />
23 Tripura 0.00 0.00 0.00 0.00 0.00 0.00 0.00 0.00 0.00 0.00 0.00 0.00 0.00 0.00 0.00<br />
24 Uttar Pradesh 139.01 0.68 0.49 130.47 0.58 0.44 23.17 0.28 1.21 245.94 0.98 0.40 0.37 0.00 0.00<br />
25 West Bengal 0.00 0.00 0.00 0.00 0.00 0.00 0.00 0.00 0.00 0.00 0.00 0.00 0.00 0.00 0.00<br />
26 ALL INDIA 4988.99 29.52 0.59 1522.35 6.31 0.41 446.26 3.40 0.76 5872.70 31.25 0.53 192.38 1.18 0.61<br />
Annexure – XXXX<br />
S.No<br />
<strong>Losses</strong> <strong>of</strong> <strong>Jowar</strong> during Storage at Farm Level–By Causes <strong>of</strong> <strong>Losses</strong><br />
(Triennium ending 1998-99) (in ‘000<br />
tonnes)<br />
CAUSES OF LOSSES<br />
Driage Rodents Infestation H<strong>and</strong>ling Quality<br />
Others<br />
Name <strong>of</strong> State Quantity Percent to Quantity Percent to Quantity Percent to Quantity Percent to<br />
lost col. 15 lost col. 15 lost col. 15 lost col. 15<br />
deterioration<br />
Quantity<br />
lost<br />
Percent to<br />
col. 15<br />
Quantity<br />
lost<br />
Percent to<br />
col. 15<br />
1 2 3 4 5 6 7 8 9 10 11 12 13 14 15<br />
Total<br />
quantity<br />
lost