Marketed Surplus and Post-harvest Losses of Jowar - Agmarknet
Marketed Surplus and Post-harvest Losses of Jowar - Agmarknet
Marketed Surplus and Post-harvest Losses of Jowar - Agmarknet

Create successful ePaper yourself
Turn your PDF publications into a flip-book with our unique Google optimized e-Paper software.
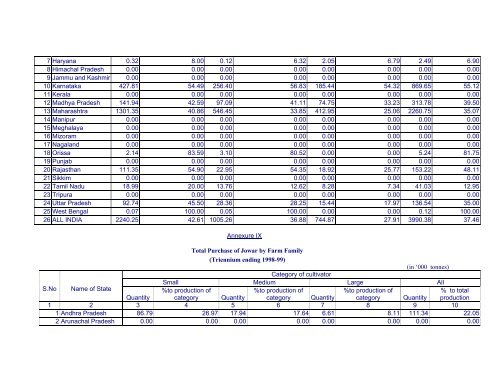
7 Haryana 0.32 8.00 0.12 6.32 2.05 6.79 2.49 6.90<br />
8 Himachal Pradesh 0.00 0.00 0.00 0.00 0.00 0.00 0.00 0.00<br />
9 Jammu <strong>and</strong> Kashmir 0.00 0.00 0.00 0.00 0.00 0.00 0.00 0.00<br />
10 Karnataka 427.81 54.49 256.40 56.83 185.44 54.32 869.65 55.12<br />
11 Kerala 0.00 0.00 0.00 0.00 0.00 0.00 0.00 0.00<br />
12 Madhya Pradesh 141.94 42.59 97.09 41.11 74.75 33.23 313.78 39.50<br />
13 Maharashtra 1301.35 40.86 546.45 33.85 412.95 25.06 2260.75 35.07<br />
14 Manipur 0.00 0.00 0.00 0.00 0.00 0.00 0.00 0.00<br />
15 Meghalaya 0.00 0.00 0.00 0.00 0.00 0.00 0.00 0.00<br />
16 Mizoram 0.00 0.00 0.00 0.00 0.00 0.00 0.00 0.00<br />
17 Nagal<strong>and</strong> 0.00 0.00 0.00 0.00 0.00 0.00 0.00 0.00<br />
18 Orissa 2.14 83.59 3.10 80.52 0.00 0.00 5.24 81.75<br />
19 Punjab 0.00 0.00 0.00 0.00 0.00 0.00 0.00 0.00<br />
20 Rajasthan 111.35 54.90 22.95 54.35 18.92 25.77 153.22 48.11<br />
21 Sikkim 0.00 0.00 0.00 0.00 0.00 0.00 0.00 0.00<br />
22 Tamil Nadu 18.99 20.00 13.76 12.62 8.28 7.34 41.03 12.95<br />
23 Tripura 0.00 0.00 0.00 0.00 0.00 0.00 0.00 0.00<br />
24 Uttar Pradesh 92.74 45.50 28.36 28.25 15.44 17.97 136.54 35.00<br />
25 West Bengal 0.07 100.00 0.05 100.00 0.00 0.00 0.12 100.00<br />
26 ALL INDIA 2240.25 42.61 1005.26 36.88 744.87 27.91 3990.38 37.46<br />
Annexure IX<br />
Total Purchase <strong>of</strong> <strong>Jowar</strong> by Farm Family<br />
(Triennium ending 1998-99)<br />
(in ‘000 tonnes)<br />
Small<br />
Category <strong>of</strong> cultivator<br />
Medium Large All<br />
S.No Name <strong>of</strong> State<br />
%to production <strong>of</strong><br />
%to production <strong>of</strong><br />
%to production <strong>of</strong><br />
% to total<br />
Quantity category Quantity category Quantity category Quantity production<br />
1 2 3 4 5 6 7 8 9 10<br />
1 Andhra Pradesh 86.79 26.97 17.94 17.64 6.61 8.11 111.34 22.05<br />
2 Arunachal Pradesh 0.00 0.00 0.00 0.00 0.00 0.00 0.00 0.00