Marketed Surplus and Post-harvest Losses of Jowar - Agmarknet
Marketed Surplus and Post-harvest Losses of Jowar - Agmarknet
Marketed Surplus and Post-harvest Losses of Jowar - Agmarknet

You also want an ePaper? Increase the reach of your titles
YUMPU automatically turns print PDFs into web optimized ePapers that Google loves.
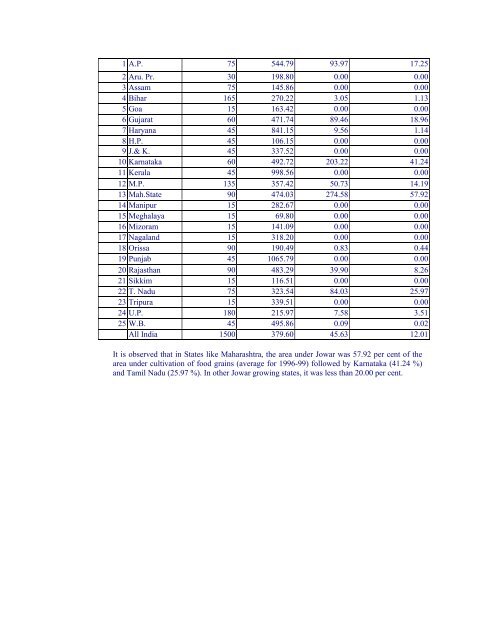
1 A.P. 75 544.79 93.97 17.25<br />
2 Aru. Pr. 30 198.80 0.00 0.00<br />
3 Assam 75 145.86 0.00 0.00<br />
4 Bihar 165 270.22 3.05 1.13<br />
5 Goa 15 163.42 0.00 0.00<br />
6 Gujarat 60 471.74 89.46 18.96<br />
7 Haryana 45 841.15 9.56 1.14<br />
8 H.P. 45 106.15 0.00 0.00<br />
9 J.& K. 45 337.52 0.00 0.00<br />
10 Karnataka 60 492.72 203.22 41.24<br />
11 Kerala 45 998.56 0.00 0.00<br />
12 M.P. 135 357.42 50.73 14.19<br />
13 Mah.State 90 474.03 274.58 57.92<br />
14 Manipur 15 282.67 0.00 0.00<br />
15 Meghalaya 15 69.80 0.00 0.00<br />
16 Mizoram 15 141.09 0.00 0.00<br />
17 Nagal<strong>and</strong> 15 318.20 0.00 0.00<br />
18 Orissa 90 190.49 0.83 0.44<br />
19 Punjab 45 1065.79 0.00 0.00<br />
20 Rajasthan 90 483.29 39.90 8.26<br />
21 Sikkim 15 116.51 0.00 0.00<br />
22 T. Nadu 75 323.54 84.03 25.97<br />
23 Tripura 15 339.51 0.00 0.00<br />
24 U.P. 180 215.97 7.58 3.51<br />
25 W.B. 45 495.86 0.09 0.02<br />
All India 1500 379.60 45.63 12.01<br />
It is observed that in States like Maharashtra, the area under <strong>Jowar</strong> was 57.92 per cent <strong>of</strong> the<br />
area under cultivation <strong>of</strong> food grains (average for 1996-99) followed by Karnataka (41.24 %)<br />
<strong>and</strong> Tamil Nadu (25.97 %). In other <strong>Jowar</strong> growing states, it was less than 20.00 per cent.