Marketed Surplus and Post-harvest Losses of Jowar - Agmarknet
Marketed Surplus and Post-harvest Losses of Jowar - Agmarknet
Marketed Surplus and Post-harvest Losses of Jowar - Agmarknet

Create successful ePaper yourself
Turn your PDF publications into a flip-book with our unique Google optimized e-Paper software.
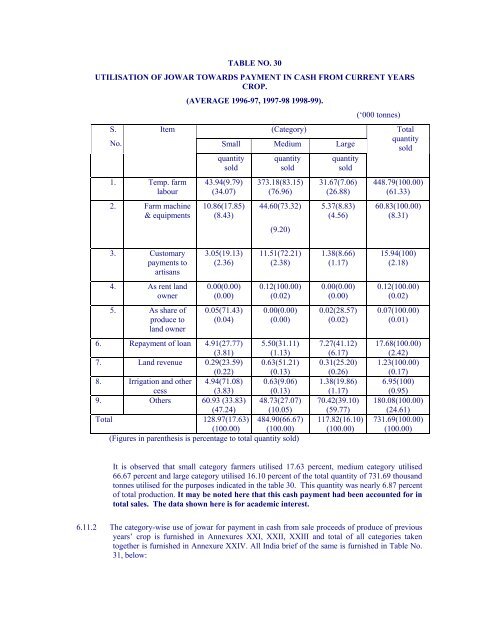
TABLE NO. 30<br />
UTILISATION OF JOWAR TOWARDS PAYMENT IN CASH FROM CURRENT YEARS<br />
CROP.<br />
(AVERAGE 1996-97, 1997-98 1998-99).<br />
(‘000 tonnes)<br />
S.<br />
Item<br />
(Category)<br />
Total<br />
No.<br />
Small Medium Large<br />
quantity<br />
sold<br />
quantity quantity quantity<br />
sold<br />
sold<br />
sold<br />
1. Temp. farm<br />
labour<br />
2. Farm machine<br />
& equipments<br />
3. Customary<br />
payments to<br />
artisans<br />
4. As rent l<strong>and</strong><br />
owner<br />
5. As share <strong>of</strong><br />
produce to<br />
l<strong>and</strong> owner<br />
43.94(9.79)<br />
(34.07)<br />
10.86(17.85)<br />
(8.43)<br />
3.05(19.13)<br />
(2.36)<br />
0.00(0.00)<br />
(0.00)<br />
0.05(71.43)<br />
(0.04)<br />
373.18(83.15)<br />
(76.96)<br />
44.60(73.32)<br />
(9.20)<br />
11.51(72.21)<br />
(2.38)<br />
0.12(100.00)<br />
(0.02)<br />
0.00(0.00)<br />
(0.00)<br />
6. Repayment <strong>of</strong> loan 4.91(27.77) 5.50(31.11)<br />
(3.81) (1.13)<br />
7. L<strong>and</strong> revenue 0.29(23.59) 0.63(51.21)<br />
(0.22) (0.13)<br />
8. Irrigation <strong>and</strong> other 4.94(71.08) 0.63(9.06)<br />
cess<br />
(3.83) (0.13)<br />
9. Others 60.93 (33.83) 48.73(27.07)<br />
(47.24) (10.05)<br />
Total 128.97(17.63) 484.90(66.67)<br />
(100.00) (100.00)<br />
(Figures in parenthesis is percentage to total quantity sold)<br />
31.67(7.06)<br />
(26.88)<br />
5.37(8.83)<br />
(4.56)<br />
1.38(8.66)<br />
(1.17)<br />
0.00(0.00)<br />
(0.00)<br />
0.02(28.57)<br />
(0.02)<br />
7.27(41.12)<br />
(6.17)<br />
0.31(25.20)<br />
(0.26)<br />
1.38(19.86)<br />
(1.17)<br />
70.42(39.10)<br />
(59.77)<br />
117.82(16.10)<br />
(100.00)<br />
448.79(100.00)<br />
(61.33)<br />
60.83(100.00)<br />
(8.31)<br />
15.94(100)<br />
(2.18)<br />
0.12(100.00)<br />
(0.02)<br />
0.07(100.00)<br />
(0.01)<br />
17.68(100.00)<br />
(2.42)<br />
1.23(100.00)<br />
(0.17)<br />
6.95(100)<br />
(0.95)<br />
180.08(100.00)<br />
(24.61)<br />
731.69(100.00)<br />
(100.00)<br />
It is observed that small category farmers utilised 17.63 percent, medium category utilised<br />
66.67 percent <strong>and</strong> large category utilised 16.10 percent <strong>of</strong> the total quantity <strong>of</strong> 731.69 thous<strong>and</strong><br />
tonnes utilised for the purposes indicated in the table 30. This quantity was nearly 6.87 percent<br />
<strong>of</strong> total production. It may be noted here that this cash payment had been accounted for in<br />
total sales. The data shown here is for academic interest.<br />
6.11.2 The category-wise use <strong>of</strong> jowar for payment in cash from sale proceeds <strong>of</strong> produce <strong>of</strong> previous<br />
years’ crop is furnished in Annexures XXI, XXII, XXIII <strong>and</strong> total <strong>of</strong> all categories taken<br />
together is furnished in Annexure XXIV. All India brief <strong>of</strong> the same is furnished in Table No.<br />
31, below: