Marketed Surplus and Post-harvest Losses of Jowar - Agmarknet
Marketed Surplus and Post-harvest Losses of Jowar - Agmarknet
Marketed Surplus and Post-harvest Losses of Jowar - Agmarknet

You also want an ePaper? Increase the reach of your titles
YUMPU automatically turns print PDFs into web optimized ePapers that Google loves.
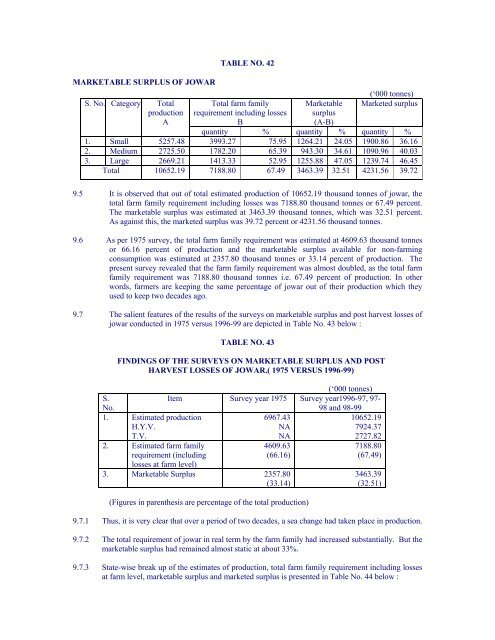
MARKETABLE SURPLUS OF JOWAR<br />
S. No. Category Total<br />
production<br />
A<br />
TABLE NO. 42<br />
Total farm family<br />
requirement including losses<br />
B<br />
Marketable<br />
surplus<br />
(A-B)<br />
(‘000 tonnes)<br />
<strong>Marketed</strong> surplus<br />
quantity % quantity % quantity %<br />
1. Small 5257.48 3993.27 75.95 1264.21 24.05 1900.86 36.16<br />
2. Medium 2725.50 1782.20 65.39 943.30 34.61 1090.96 40.03<br />
3. Large 2669.21 1413.33 52.95 1255.88 47.05 1239.74 46.45<br />
Total 10652.19 7188.80 67.49 3463.39 32.51 4231.56 39.72<br />
9.5 It is observed that out <strong>of</strong> total estimated production <strong>of</strong> 10652.19 thous<strong>and</strong> tonnes <strong>of</strong> jowar, the<br />
total farm family requirement including losses was 7188.80 thous<strong>and</strong> tonnes or 67.49 percent.<br />
The marketable surplus was estimated at 3463.39 thous<strong>and</strong> tonnes, which was 32.51 percent.<br />
As against this, the marketed surplus was 39.72 percent or 4231.56 thous<strong>and</strong> tonnes.<br />
9.6 As per 1975 survey, the total farm family requirement was estimated at 4609.63 thous<strong>and</strong> tonnes<br />
or 66.16 percent <strong>of</strong> production <strong>and</strong> the marketable surplus available for non-farming<br />
consumption was estimated at 2357.80 thous<strong>and</strong> tonnes or 33.14 percent <strong>of</strong> production. The<br />
present survey revealed that the farm family requirement was almost doubled, as the total farm<br />
family requirement was 7188.80 thous<strong>and</strong> tonnes i.e. 67.49 percent <strong>of</strong> production. In other<br />
words, farmers are keeping the same percentage <strong>of</strong> jowar out <strong>of</strong> their production which they<br />
used to keep two decades ago.<br />
9.7 The salient features <strong>of</strong> the results <strong>of</strong> the surveys on marketable surplus <strong>and</strong> post <strong>harvest</strong> losses <strong>of</strong><br />
jowar conducted in 1975 versus 1996-99 are depicted in Table No. 43 below :<br />
TABLE NO. 43<br />
FINDINGS OF THE SURVEYS ON MARKETABLE SURPLUS AND POST<br />
HARVEST LOSSES OF JOWAR.( 1975 VERSUS 1996-99)<br />
S.<br />
Item Survey year 1975<br />
(‘000 tonnes)<br />
Survey year1996-97, 97-<br />
No.<br />
98 <strong>and</strong> 98-99<br />
1. Estimated production<br />
6967.43<br />
10652.19<br />
H.Y.V.<br />
NA<br />
7924.37<br />
T.V.<br />
NA<br />
2727.82<br />
2. Estimated farm family<br />
4609.63<br />
7188.80<br />
requirement (including<br />
losses at farm level)<br />
(66.16)<br />
(67.49)<br />
3. Marketable <strong>Surplus</strong> 2357.80<br />
3463.39<br />
(33.14)<br />
(32.51)<br />
(Figures in parenthesis are percentage <strong>of</strong> the total production)<br />
9.7.1 Thus, it is very clear that over a period <strong>of</strong> two decades, a sea change had taken place in production.<br />
9.7.2 The total requirement <strong>of</strong> jowar in real term by the farm family had increased substantially. But the<br />
marketable surplus had remained almost static at about 33%.<br />
9.7.3 State-wise break up <strong>of</strong> the estimates <strong>of</strong> production, total farm family requirement including losses<br />
at farm level, marketable surplus <strong>and</strong> marketed surplus is presented in Table No. 44 below :