Marketed Surplus and Post-harvest Losses of Jowar - Agmarknet
Marketed Surplus and Post-harvest Losses of Jowar - Agmarknet
Marketed Surplus and Post-harvest Losses of Jowar - Agmarknet

You also want an ePaper? Increase the reach of your titles
YUMPU automatically turns print PDFs into web optimized ePapers that Google loves.
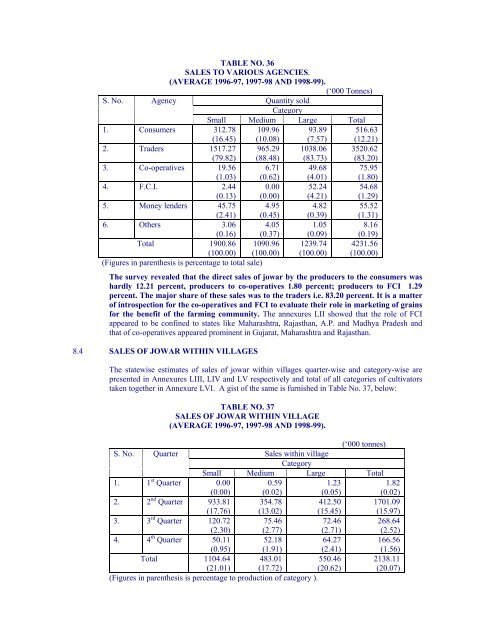
TABLE NO. 36<br />
SALES TO VARIOUS AGENCIES.<br />
(AVERAGE 1996-97, 1997-98 AND 1998-99).<br />
(‘000 Tonnes)<br />
S. No. Agency<br />
Quantity sold<br />
Category<br />
Small Medium Large Total<br />
1. Consumers 312.78 109.96 93.89 516.63<br />
(16.45) (10.08) (7.57) (12.21)<br />
2. Traders 1517.27 965.29 1038.06 3520.62<br />
(79.82) (88.48) (83.73) (83.20)<br />
3. Co-operatives 19.56 6.71 49.68 75.95<br />
(1.03) (0.62) (4.01) (1.80)<br />
4. F.C.I. 2.44 0.00 52.24 54.68<br />
(0.13) (0.00) (4.21) (1.29)<br />
5. Money lenders 45.75 4.95 4.82 55.52<br />
(2.41) (0.45) (0.39) (1.31)<br />
6. Others 3.06 4.05 1.05 8.16<br />
(0.16) (0.37) (0.09) (0.19)<br />
Total 1900.86 1090.96 1239.74 4231.56<br />
(100.00) (100.00) (100.00) (100.00)<br />
(Figures in parenthesis is percentage to total sale)<br />
The survey revealed that the direct sales <strong>of</strong> jowar by the producers to the consumers was<br />
hardly 12.21 percent, producers to co-operatives 1.80 percent; producers to FCI 1.29<br />
percent. The major share <strong>of</strong> these sales was to the traders i.e. 83.20 percent. It is a matter<br />
<strong>of</strong> introspection for the co-operatives <strong>and</strong> FCI to evaluate their role in marketing <strong>of</strong> grains<br />
for the benefit <strong>of</strong> the farming community. The annexures LII showed that the role <strong>of</strong> FCI<br />
appeared to be confined to states like Maharashtra, Rajasthan, A.P. <strong>and</strong> Madhya Pradesh <strong>and</strong><br />
that <strong>of</strong> co-operatives appeared prominent in Gujarat, Maharashtra <strong>and</strong> Rajasthan.<br />
8.4 SALES OF JOWAR WITHIN VILLAGES<br />
The statewise estimates <strong>of</strong> sales <strong>of</strong> jowar within villages quarter-wise <strong>and</strong> category-wise are<br />
presented in Annexures LIII, LIV <strong>and</strong> LV respectively <strong>and</strong> total <strong>of</strong> all categories <strong>of</strong> cultivators<br />
taken together in Annexure LVI. A gist <strong>of</strong> the same is furnished in Table No. 37, below:<br />
TABLE NO. 37<br />
SALES OF JOWAR WITHIN VILLAGE<br />
(AVERAGE 1996-97, 1997-98 AND 1998-99).<br />
(‘000 tonnes)<br />
S. No. Quarter<br />
Sales within village<br />
Category<br />
Small Medium Large Total<br />
1. 1 st Quarter 0.00 0.59<br />
1.23<br />
1.82<br />
(0.00) (0.02) (0.05) (0.02)<br />
2. 2 nd Quarter 933.81 354.78 412.50 1701.09<br />
(17.76) (13.02) (15.45) (15.97)<br />
3. 3 rd Quarter 120.72 75.46<br />
72.46 268.64<br />
(2.30) (2.77) (2.71) (2.52)<br />
4. 4 th Quarter 50.11 52.18<br />
64.27 166.56<br />
(0.95) (1.91) (2.41) (1.56)<br />
Total 1104.64 483.01 550.46 2138.11<br />
(21.01) (17.72) (20.62) (20.07)<br />
(Figures in parenthesis is percentage to production <strong>of</strong> category ).