p17n63qg7jmbh1r4fin71pds1p454.pdf

Create successful ePaper yourself
Turn your PDF publications into a flip-book with our unique Google optimized e-Paper software.
32<br />
S&p 500 Index<br />
exeCUtIVe DIreCtor’S Letter Unit Trust Corporation Annual Report 2012<br />
along with new oil and gas finds.<br />
In January 2013, the IMF revised its 2013<br />
projection for world growth to 3.5 percent,<br />
marginally lower than its October 2012 forecast<br />
of 3.6 percent. World trade is expected<br />
to decelerate further, expanding a pace of 3.8<br />
percent in 2013 following 2.8 percent growth<br />
in 2012. Commodity prices are also expected<br />
to ease, while inflation should remain stable<br />
in the developed economies though rising<br />
slightly in the emerging market and developing<br />
economies. Global economic growth<br />
may achieve these estimates as long as major<br />
crisis risks do not materialize, particularly<br />
in the Euro-area and US. Any substantial deterioration<br />
in economic conditions for either<br />
of these economies would suggest negative<br />
implications for global economic growth.<br />
fInanCIal maRkets-nteRnatIOnal<br />
equIty PeRfORmanCe<br />
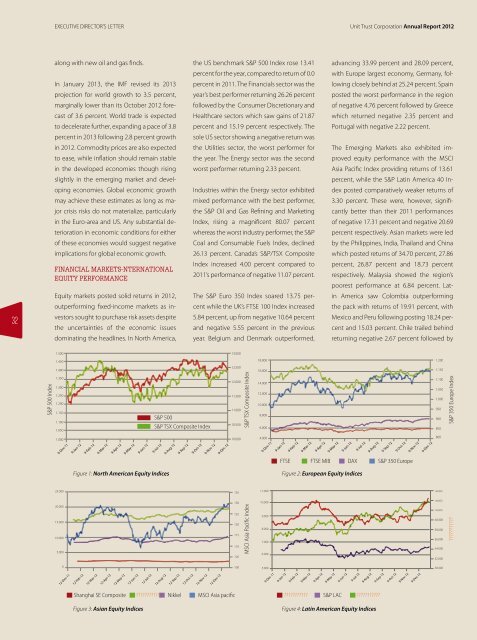
Equity markets posted solid returns in 2012,<br />
outperforming fixed-income markets as investors<br />
sought to purchase risk assets despite<br />
the uncertainties of the economic issues<br />
dominating the headlines. In north America,<br />
1.500<br />
1.450<br />
1.400<br />
1.350<br />
1.300<br />
1.250<br />
1.200<br />
1.150<br />
1.100<br />
1.050<br />
1.000<br />
25.000<br />
20.000<br />
15.000<br />
10.000<br />
9-Dec-11<br />
5.000<br />
0<br />
12-Dec-11<br />
9-Jan-12<br />
12-Feb-12<br />
9-Feb-12<br />
12-Mar-12<br />
9-Mar-12<br />
12-Apr-12<br />
9-Apr-12<br />
12-May-12<br />
9-May-12<br />
12-Jun-12<br />
9-Jun-12<br />
12-Jul-12<br />
S&p 500<br />
9-Jul-12<br />
Figure 1: North American Equity Indices<br />
S&p tSx Composite Index<br />
12-Aug-12<br />
9-Aug-12<br />
12-Sep-12<br />
9-Sep-12<br />
12-Oct-12<br />
the US benchmark S&P 500 Index rose 13.41<br />
percent for the year, compared to return of 0.0<br />
percent in 2011. The Financials sector was the<br />
year’s best performer returning 26.26 percent<br />
followed by the Consumer Discretionary and<br />
Healthcare sectors which saw gains of 21.87<br />
percent and 15.19 percent respectively. The<br />
sole US sector showing a negative return was<br />
the Utilities sector, the worst performer for<br />
the year. The Energy sector was the second<br />
worst performer returning 2.33 percent.<br />
Industries within the Energy sector exhibited<br />
mixed performance with the best performer,<br />
the S&P Oil and Gas Refining and Marketing<br />
Index, rising a magnificent 80.07 percent<br />
whereas the worst industry performer, the S&P<br />
Coal and Consumable Fuels Index, declined<br />
26.13 percent. Canada’s S&P/TSX Composite<br />
Index increased 4.00 percent compared to<br />
2011’s performance of negative 11.07 percent.<br />
The S&P Euro 350 Index soared 13.75 per-<br />
cent while the Uk’s FTSE 100 Index increased<br />
5.84 percent, up from negative 10.64 percent<br />
and negative 5.55 percent in the previous<br />
year. Belgium and Denmark outperformed,<br />
9-Oct-12<br />
12-Nov-12<br />
9-Nov-12<br />
12-Dec-12<br />
9-Dec-12<br />
Shanghai Se Composite ??????????? nikkel mSCI asia pacific<br />
??????????? S&p LaC ???????????<br />
13.000<br />
12.500<br />
12.000<br />
11.500<br />
11.000<br />
10.500<br />
10.000<br />
135<br />
130<br />
125<br />
120<br />
115<br />
110<br />
105<br />
100<br />
S&p tSx Composite Index<br />
mSCI asia pacific Index<br />
18.000<br />
16.000<br />
14.000<br />
12.000<br />
10.000<br />
8.000<br />
6.000<br />
4.000<br />
9-Dec-11<br />
11.000<br />
10.000<br />
9.000<br />
8.000<br />
7.000<br />
6.000<br />
5.000<br />
9-Dec-11<br />
9-Jan-12<br />
ftSe<br />
9-Jan-12<br />
9-Feb-12<br />
9-Feb-12<br />
9-Mar-12<br />
9-Mar-12<br />
9-Apr-12<br />
ftSe mIB<br />
9-Apr-12<br />
9-May-12<br />
9-May-12<br />
9-Jun-12<br />
9-Jun-12<br />
Dax<br />
9-Jul-12<br />
9-Jul-12<br />
Figure 2: European Equity Indices<br />
Figure 3: Asian Equity Indices Figure 4: Latin American Equity Indices<br />
advancing 33.99 percent and 28.09 percent,<br />
with Europe largest economy, Germany, following<br />
closely behind at 25.24 percent. Spain<br />
posted the worst performance in the region<br />
of negative 4.76 percent followed by Greece<br />
which returned negative 2.35 percent and<br />
Portugal with negative 2.22 percent.<br />
The Emerging Markets also exhibited improved<br />
equity performance with the MSCI<br />
Asia Pacific Index providing returns of 13.61<br />
percent, while the S&P Latin America 40 Index<br />
posted comparatively weaker returns of<br />
3.30 percent. These were, however, significantly<br />
better than their 2011 performances<br />
of negative 17.31 percent and negative 20.69<br />
percent respectively. Asian markets were led<br />
by the Philippines, India, Thailand and China<br />
which posted returns of 34.70 percent, 27.86<br />
percent, 26.87 percent and 18.73 percent<br />
respectively. Malaysia showed the region’s<br />
poorest performance at 6.84 percent. Latin<br />
America saw Colombia outperforming<br />
the pack with returns of 19.91 percent, with<br />
Mexico and Peru following posting 18.24 percent<br />
and 15.03 percent. Chile trailed behind<br />
returning negative 2.67 percent followed by<br />
9-Aug-12<br />
9-Aug-12<br />
9-Sep-12<br />
9-Sep-12<br />
9-Oct-12<br />
9-Oct-12<br />
S&p 350 europe<br />
9-Nov-12<br />
9-Nov-12<br />
9-Dec-12<br />
9-Dec-12<br />
1.200<br />
1.150<br />
1.100<br />
1.050<br />
1.000<br />
950<br />
900<br />
850<br />
800<br />
46.000<br />
44.000<br />
42.000<br />
40.000<br />
38.000<br />
36.000<br />
34.000<br />
32.000<br />
30.000<br />
??????????? S&p 350 europe Index