p17n63qg7jmbh1r4fin71pds1p454.pdf

Create successful ePaper yourself
Turn your PDF publications into a flip-book with our unique Google optimized e-Paper software.
Notes to the Consolidated Financial Statements<br />
FOR THE YEAR ENDED 31 DECEMBER, 2012<br />
Expressed in Trinidad and Tobago dollars<br />
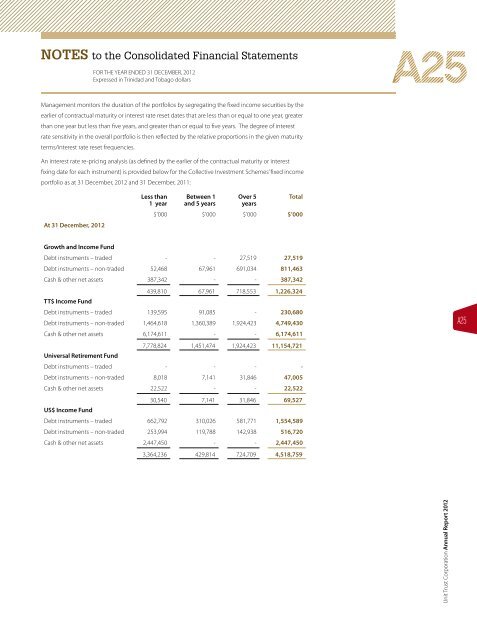
Management monitors the duration of the portfolios by segregating the fixed income securities by the<br />
earlier of contractual maturity or interest rate reset dates that are less than or equal to one year, greater<br />
than one year but less than five years, and greater than or equal to five years. The degree of interest<br />
rate sensitivity in the overall portfolio is then reflected by the relative proportions in the given maturity<br />
terms/interest rate reset frequencies.<br />
An interest rate re-pricing analysis (as defined by the earlier of the contractual maturity or interest<br />
fixing date for each instrument) is provided below for the Collective Investment Schemes’ fixed income<br />
portfolio as at 31 December, 2012 and 31 December, 2011:<br />
At 31 December, 2012<br />
Less than<br />
1 year<br />
Between 1<br />
and 5 years<br />
Over 5<br />
years<br />
Total<br />
$’000 $’000 $’000 $’000<br />
Growth and Income Fund<br />
Debt instruments – traded - - 27,519 27,519<br />
Debt instruments – non-traded 52,468 67,961 691,034 811,463<br />
Cash & other net assets 387,342 - - 387,342<br />
TT$ Income Fund<br />
439,810 67,961 718,553 1,226,324<br />
Debt instruments – traded 139,595 91,085 - 230,680<br />
Debt instruments – non-traded 1,464,618 1,360,389 1,924,423 4,749,430<br />
Cash & other net assets 6,174,611 - - 6,174,611<br />
Universal Retirement Fund<br />
7,778,824 1,451,474 1,924,423 11,154,721<br />
Debt instruments – traded - - - -<br />
Debt instruments – non-traded 8,018 7,141 31,846 47,005<br />
Cash & other net assets 22,522 - - 22,522<br />
US$ Income Fund<br />
30,540 7,141 31,846 69,527<br />
Debt instruments – traded 662,792 310,026 581,771 1,554,589<br />
Debt instruments – non-traded 253,994 119,788 142,938 516,720<br />
Cash & other net assets 2,447,450 - - 2,447,450<br />
3,364,236 429,814 724,709 4,518,759<br />
A25<br />
Unit Trust Corporation Annual Report 2012<br />
A25