p17n63qg7jmbh1r4fin71pds1p454.pdf

You also want an ePaper? Increase the reach of your titles
YUMPU automatically turns print PDFs into web optimized ePapers that Google loves.
Notes to the Consolidated Financial Statements<br />
FOR THE YEAR ENDED 31 DECEMBER, 2012<br />
Expressed in Trinidad and Tobago dollars<br />
Strategy in using financial instruments<br />
Financial risks arise from the acquisition of various classes of<br />
financial instruments including equity and debt instruments<br />
(traded and non-traded). With regard to its Collective Investment<br />
Scheme business, the Corporation’s practice is to acquire financial<br />
assets that provide consistent risk-adjusted returns relative to<br />
specific investment objectives of the individual portfolios. In<br />
general, the investment activities of the Funds involve taking long<br />
positions in securities with a focus on medium term performance<br />
as opposed to short-term gains-taking. The Collective Investment<br />
Schemes neither use leverage nor sell securities short and have no<br />
financial liabilities arising out of their investment activities.<br />
In respect of its Treasury function, the Corporation’s strategy<br />
focuses on cash management while earning intermediation<br />
income via the interest spread of its financial assets over its<br />
associated funding instruments.<br />
Equity price risk<br />
Collective Investment Schemes – Registered locally as<br />
unit trusts<br />
The Growth & Income Fund and the Universal Retirement Fund<br />
may acquire equity instruments that are exposed to fluctuations<br />
in market value. These exposures create equity price risk for the<br />
portfolios and may contribute to substantial volatility in the value<br />
of their net assets. This risk is managed via careful asset allocation<br />
and security selection within specified limits.<br />
key influences on the asset allocation decision include domestic<br />
as well as global economic and financial market trends. In<br />
the case of equity, the security selection decision is typically<br />
influenced by consideration of fundamental and technical<br />
valuation factors as well as by the instrument’s historical price<br />
sensitivity to the stock market, otherwise known as its beta. The<br />
amount of a particular security eventually acquired takes into<br />
account the need to maintain appropriate levels of diversification<br />
at the overall portfolio level.<br />
The equity price risk exposure of the portfolios is monitored and<br />
measured via categorization of the stocks by their beta. Stocks<br />
that have a beta close of 1 would change by approximately 1% for<br />
every 1% move in the overall stock market.<br />
By contrast, a stock with a beta of 0.5 would change by<br />
approximately 0.5% for every 1% change in the market while a<br />
stock with a beta of 1.5 would change by approximately 1.5% for<br />
every 1% change in the market. A stock with a beta below 0.9<br />
is considered to have low equity price risk relative to the overall<br />
market whereas a stock with a beta above 1.1 is considered to<br />
have high equity price risk relative to the overall market. A stock<br />
with a beta between 0.9 and 1.1 is regarded as having equity price<br />
risk comparable to the overall market.<br />
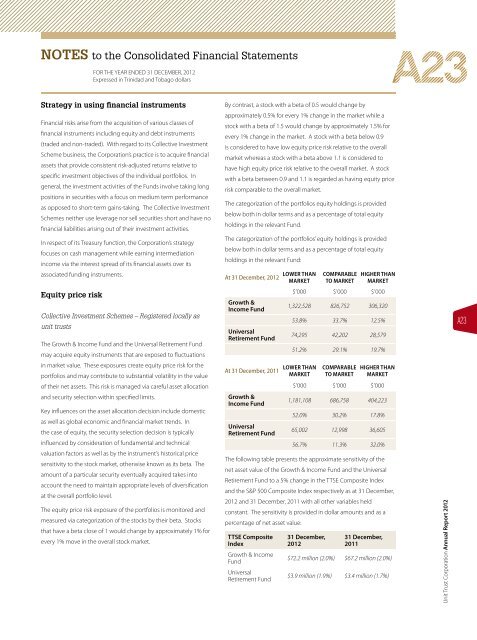
The categorization of the portfolios equity holdings is provided<br />
below both in dollar terms and as a percentage of total equity<br />
holdings in the relevant Fund.<br />
The categorization of the portfolios’ equity holdings is provided<br />
below both in dollar terms and as a percentage of total equity<br />
holdings in the relevant Fund:<br />
At 31 December, 2012<br />
Growth &<br />
Income Fund<br />
Universal<br />
Retirement Fund<br />
At 31 December, 2011<br />
Growth &<br />
Income Fund<br />
Universal<br />
Retirement Fund<br />
LOWER THAN<br />
MARKET<br />
COMPARABLE<br />
TO MARKET<br />
HIGHER THAN<br />
MARKET<br />
$’000 $’000 $’000<br />
1,322,528 826,752 306,320<br />
53.8% 33.7% 12.5%<br />
74,295 42,202 28,579<br />
51.2% 29.1% 19.7%<br />
LOWER THAN<br />
MARKET<br />
COMPARABLE<br />
TO MARKET<br />
HIGHER THAN<br />
MARKET<br />
$’000 $’000 $’000<br />
1,181,108 686,758 404,223<br />
52.0% 30.2% 17.8%<br />
65,002 12,998 36,605<br />
56.7% 11.3% 32.0%<br />
The following table presents the approximate sensitivity of the<br />
net asset value of the Growth & Income Fund and the Universal<br />
Retirement Fund to a 5% change in the TTSE Composite Index<br />
and the S&P 500 Composite Index respectively as at 31 December,<br />
2012 and 31 December, 2011 with all other variables held<br />
constant. The sensitivity is provided in dollar amounts and as a<br />
percentage of net asset value:<br />
TTSE Composite<br />
Index<br />
Growth & Income<br />
Fund<br />
Universal<br />
Retirement Fund<br />
31 December,<br />
2012<br />
31 December,<br />
2011<br />
$72.2 million (2.0%) $67.2 million (2.0%)<br />
$3.9 million (1.9%) $3.4 million (1.7%)<br />
A23<br />
Unit Trust Corporation Annual Report 2012<br />
A23