p17n63qg7jmbh1r4fin71pds1p454.pdf

Create successful ePaper yourself
Turn your PDF publications into a flip-book with our unique Google optimized e-Paper software.
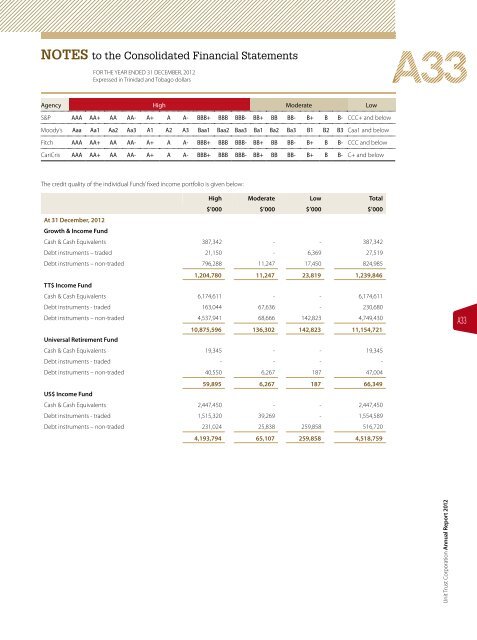
Notes to the Consolidated Financial Statements<br />
FOR THE YEAR ENDED 31 DECEMBER, 2012<br />
Expressed in Trinidad and Tobago dollars<br />
Agency High Moderate Low<br />
S&P AAA AA+ AA AA- A+ A A- BBB+ BBB BBB- BB+ BB BB- B+ B B- CCC+ and below<br />
Moody’s Aaa Aa1 Aa2 Aa3 A1 A2 A3 Baa1 Baa2 Baa3 Ba1 Ba2 Ba3 B1 B2 B3 Caa1 and below<br />
Fitch AAA AA+ AA AA- A+ A A- BBB+ BBB BBB- BB+ BB BB- B+ B B- CCC and below<br />
CariCris AAA AA+ AA AA- A+ A A- BBB+ BBB BBB- BB+ BB BB- B+ B B- C+ and below<br />
The credit quality of the individual Funds’ fixed income portfolio is given below:<br />
High Moderate Low Total<br />
$’000 $’000 $’000 $’000<br />
At 31 December, 2012<br />
Growth & Income Fund<br />
Cash & Cash Equivalents 387,342 - - 387,342<br />
Debt instruments – traded 21,150 - 6,369 27,519<br />
Debt instruments – non-traded 796,288 11,247 17,450 824,985<br />
TT$ Income Fund<br />
1,204,780 11,247 23,819 1,239,846<br />
Cash & Cash Equivalents 6,174,611 - - 6,174,611<br />
Debt instruments - traded 163,044 67,636 - 230,680<br />
Debt instruments – non-traded 4,537,941 68,666 142,823 4,749,430<br />
Universal Retirement Fund<br />
10,875,596 136,302 142,823 11,154,721<br />
Cash & Cash Equivalents 19,345 - - 19,345<br />
Debt instruments - traded - - - -<br />
Debt instruments – non-traded 40,550 6,267 187 47,004<br />
US$ Income Fund<br />
59,895 6,267 187 66,349<br />
Cash & Cash Equivalents 2,447,450 - - 2,447,450<br />
Debt instruments - traded 1,515,320 39,269 - 1,554,589<br />
Debt instruments – non-traded 231,024 25,838 259,858 516,720<br />
4,193,794 65,107 259,858 4,518,759<br />
A33<br />
Unit Trust Corporation Annual Report 2012<br />
A33