p17n63qg7jmbh1r4fin71pds1p454.pdf

Create successful ePaper yourself
Turn your PDF publications into a flip-book with our unique Google optimized e-Paper software.
A24<br />
A24<br />
| FInAnCIAL RISk MAnAGEMEnT|<br />
Unit Trust Corporation Annual Report 2012<br />
Trinidad and Tobago Unit Trust Corporation<br />
Notes<br />
to the Consolidated<br />
Financial Statements<br />
S&P 500<br />
Composite Index<br />
Growth & Income<br />
Fund<br />
Universal<br />
Retirement Fund<br />
31 December,<br />
2012<br />
31 December,<br />
2011<br />
$35.3 million (1.0%) $30.2 million<br />
(0.9%)<br />
$1.8 million (0.9%) $0.8 million (0.4%)<br />
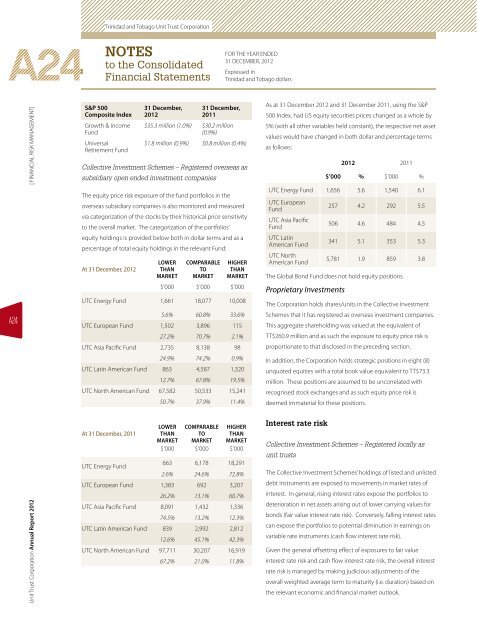
Collective Investment Schemes – Registered overseas as<br />
subsidiary open ended investment companies<br />
The equity price risk exposure of the fund portfolios in the<br />
overseas subsidiary companies is also monitored and measured<br />
via categorization of the stocks by their historical price sensitivity<br />
to the overall market. The categorization of the portfolios’<br />
equity holdings is provided below both in dollar terms and as a<br />
percentage of total equity holdings in the relevant Fund:<br />
At 31 December, 2012<br />
LOWER<br />
THAN<br />
MARKET<br />
COMPARABLE<br />
TO<br />
MARKET<br />
FOR THE YEAR ENDED<br />
31 DECEMBER, 2012<br />
Expressed in<br />
Trinidad and Tobago dollars<br />
HIGHER<br />
THAN<br />
MARKET<br />
$’000 $’000 $’000<br />
UTC Energy Fund 1,661 18,077 10,008<br />
5.6% 60.8% 33.6%<br />
UTC European Fund 1,502 3,896 115<br />
27.2% 70.7% 2.1%<br />
UTC Asia Pacific Fund 2,735 8,138 98<br />
24.9% 74.2% 0.9%<br />
UTC Latin American Fund 863 4,587 1,320<br />
12.7% 67.8% 19.5%<br />
UTC north American Fund 67,582 50,533 15,241<br />
50.7% 37.9% 11.4%<br />
At 31 December, 2011<br />
LOWER<br />
THAN<br />
MARKET<br />
COMPARABLE<br />
TO<br />
MARKET<br />
HIGHER<br />
THAN<br />
MARKET<br />
$’000 $’000 $’000<br />
UTC Energy Fund<br />
663 6,178 18,291<br />
2.6% 24.6% 72.8%<br />
UTC European Fund 1,383 692 3,207<br />
26.2% 13.1% 60.7%<br />
UTC Asia Pacific Fund 8,091 1,432 1,336<br />
74.5% 13.2% 12.3%<br />
UTC Latin American Fund 839 2,992 2,812<br />
12.6% 45.1% 42.3%<br />
UTC north American Fund 97,711 30,207 16,919<br />
67.2% 21.0% 11.8%<br />
As at 31 December 2012 and 31 December 2011, using the S&P<br />
500 Index, had US equity securities prices changed as a whole by<br />
5% (with all other variables held constant), the respective net asset<br />
values would have changed in both dollar and percentage terms<br />
as follows:<br />
2012 2011<br />
$’000 % $’000 %<br />
UTC Energy Fund 1,656 5.6 1,540 6.1<br />
UTC European<br />
Fund<br />
UTC Asia Pacific<br />
Fund<br />
UTC Latin<br />
American Fund<br />
UTC north<br />
American Fund<br />
257 4.2 292 5.5<br />
506 4.6 484 4.5<br />
341 5.1 353 5.3<br />
5,781 1.9 859 3.8<br />
The Global Bond Fund does not hold equity positions.<br />
Proprietary Investments<br />
The Corporation holds shares/units in the Collective Investment<br />
Schemes that it has registered as overseas investment companies.<br />
This aggregate shareholding was valued at the equivalent of<br />
TT$260.9 million and as such the exposure to equity price risk is<br />
proportionate to that disclosed in the preceding section.<br />
In addition, the Corporation holds strategic positions in eight (8)<br />
unquoted equities with a total book value equivalent to TT$73.3<br />
million. These positions are assumed to be uncorrelated with<br />
recognised stock exchanges and as such equity price risk is<br />
deemed immaterial for these positions.<br />
Interest rate risk<br />
Collective Investment Schemes – Registered locally as<br />
unit trusts<br />
The Collective Investment Schemes’ holdings of listed and unlisted<br />
debt instruments are exposed to movements in market rates of<br />
interest. In general, rising interest rates expose the portfolios to<br />
deterioration in net assets arising out of lower carrying values for<br />
bonds (fair value interest rate risk). Conversely, falling interest rates<br />
can expose the portfolios to potential diminution in earnings on<br />
variable rate instruments (cash flow interest rate risk).<br />
Given the general offsetting effect of exposures to fair value<br />
interest rate risk and cash flow interest rate risk, the overall interest<br />
rate risk is managed by making judicious adjustments of the<br />
overall weighted average term to maturity (i.e. duration) based on<br />
the relevant economic and financial market outlook.