p17n63qg7jmbh1r4fin71pds1p454.pdf

Create successful ePaper yourself
Turn your PDF publications into a flip-book with our unique Google optimized e-Paper software.
34<br />
Per cent<br />
Per cent<br />
exeCUtIVe DIreCtor’S Letter Unit Trust Corporation Annual Report 2012<br />
6<br />
5<br />
4<br />
3<br />
2<br />
1<br />
0<br />
6<br />
5<br />
4<br />
3<br />
2<br />
1<br />
0<br />
20.00%<br />
15.00%<br />
10.00%<br />
5.00%<br />
0.00%<br />
-5.00%<br />
-10.00%<br />
-15.00%<br />
-20.00%<br />
3 Months<br />
Trinidad and Tobago Government<br />
Yield Curve - June 2012<br />
Figure 7: T&T Government Yield Curve (Jun Vs Dec 2012)<br />
3-Jan-12<br />
Trinidad and Tobago Government<br />
Yield Curve - December 2011<br />
6 Months<br />
Figure 6: T&T Government Yield Curve (Dec 2011 Vs Jun 2012)<br />
3-Feb-12<br />
3-Mar-12<br />
3-Apr-12<br />
1 Year<br />
2 Years<br />
3 Years<br />
4 Years<br />
5 Years<br />
6 Years<br />
7 Years<br />
8 Years<br />
9 Years<br />
3-May-12<br />
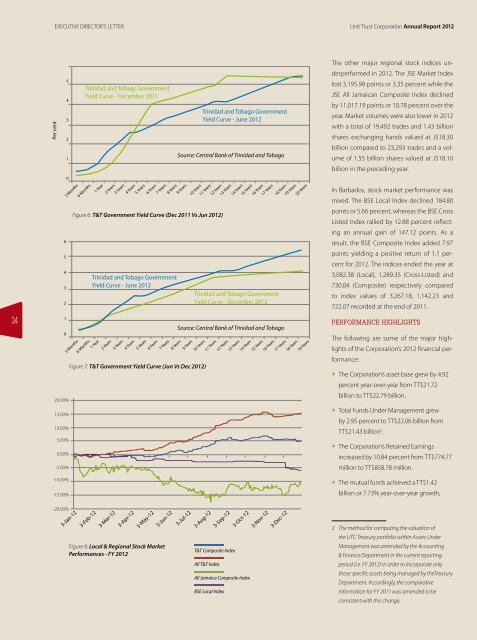
Figure 8: Local & Regional Stock Market<br />
Performances - FY 2012<br />
3-Jun-12<br />
Source: Central Bank of Trinidad and Tobago<br />
Trinidad and Tobago Government<br />
Yield Curve - December 2012<br />
Source: Central Bank of Trinidad and Tobago<br />
3 Months<br />
6 Months<br />
1 Year<br />
2 Years<br />
3 Years<br />
4 Years<br />
5 Years<br />
6 Years<br />
7 Years<br />
8 Years<br />
9 Years<br />
10 Years<br />
11 Years<br />
12 Years<br />
13 Years<br />
14 Years<br />
15 Years<br />
16 Years<br />
17 Years<br />
18 Years<br />
19 Years<br />
3-Jul-12<br />
Trinidad and Tobago Government<br />
Yield Curve - June 2012<br />
3-Aug-12<br />
3-Sep-12<br />
T&T Composite Index<br />
All T&T Index<br />
BSE Local Index<br />
10 Years<br />
11 Years<br />
12 Years<br />
13 Years<br />
14 Years<br />
15 Years<br />
16 Years<br />
17 Years<br />
3-Oct-12<br />
All Jamaica Composite Index<br />
3-Nov-12<br />
3-Dec-12<br />
18 Years<br />
19 Years<br />
20 Years<br />
The other major regional stock indices underperformed<br />
in 2012. The JSE Market Index<br />
lost 3,195.98 points or 3.35 percent while the<br />
JSE All Jamaican Composite Index declined<br />
by 11,017.19 points or 10.78 percent over the<br />
year. Market volumes were also lower in 2012<br />
with a total of 19,492 trades and 1.43 billion<br />
shares exchanging hands valued at J$18.30<br />
billion compared to 23,293 trades and a volume<br />
of 1.55 billion shares valued at J$18.10<br />
billion in the preceding year.<br />
In Barbados, stock market performance was<br />
mixed. The BSE Local Index declined 184.80<br />
points or 5.66 percent, whereas the BSE Cross<br />
Listed Index rallied by 12.88 percent reflecting<br />
an annual gain of 147.12 points. As a<br />
result, the BSE Composite Index added 7.97<br />
points yielding a positive return of 1.1 percent<br />
for 2012. The indices ended the year at<br />
3,082.38 (Local), 1,289.35 (Cross-Listed) and<br />
730.04 (Composite) respectively compared<br />
to index values of 3,267.18, 1,142.23 and<br />
722.07 recorded at the end of 2011.<br />
PeRfORmanCe HIGHlIGHts<br />
The following are some of the major highlights<br />
of the Corporation’s 2012 financial performance:<br />
y The Corporation’s asset base grew by 4.92<br />
percent year-over-year from TT$21.72<br />
billion to TT$22.79 billion.<br />
y Total Funds Under Management grew<br />
by 2.95 percent to TT$22.06 billion from<br />
TT$21.43 billion2 .<br />
y The Corporation’s Retained Earnings<br />
increased by 10.84 percent from TT$774.77<br />
million to TT$858.78 million.<br />
y The mutual funds achieved a TT$1.42<br />
billion or 7.73% year-over-year growth,<br />
2 The method for computing the valuation of<br />
the UTC Treasury portfolio within Assets Under<br />
Management was amended by the Accounting<br />
& Finance Department in the current reporting<br />
period (i.e. FY 2012) in order to incorporate only<br />
those specific assets being managed by theTreasury<br />
Department. Accordingly, the comparative<br />
information for FY 2011 was amended to be<br />
consistent with this change.