

SAS/STAT 9.2 User's Guide: The MIXED Procedure (Book Excerpt)
SAS/STAT 9.2 User's Guide: The MIXED Procedure (Book Excerpt)
SAS/STAT 9.2 User's Guide: The MIXED Procedure (Book Excerpt)

You also want an ePaper? Increase the reach of your titles
YUMPU automatically turns print PDFs into web optimized ePapers that Google loves.
proc mixed;<br />
class A B Block;<br />
model Y = A B A*B;<br />
random Block A*Block;<br />
run;<br />
An equivalent way of specifying this model is as follows:<br />
proc mixed data=sp;<br />
class A B Block;<br />
model Y = A B A*B;<br />
random intercept A / subject=Block;<br />
run;<br />
Example 56.2: Repeated Measures ✦ 4013<br />
In general, if all of the effects in the RANDOM statement can be nested within one effect, you<br />
can specify that one effect by using the SUBJECT= option. <strong>The</strong> subject effect is, in a sense, “factored<br />
out” of the random effects. <strong>The</strong> specification that uses the SUBJECT= effect can result in<br />
faster execution times for large problems because PROC <strong>MIXED</strong> is able to perform the likelihood<br />
calculations separately for each subject.<br />
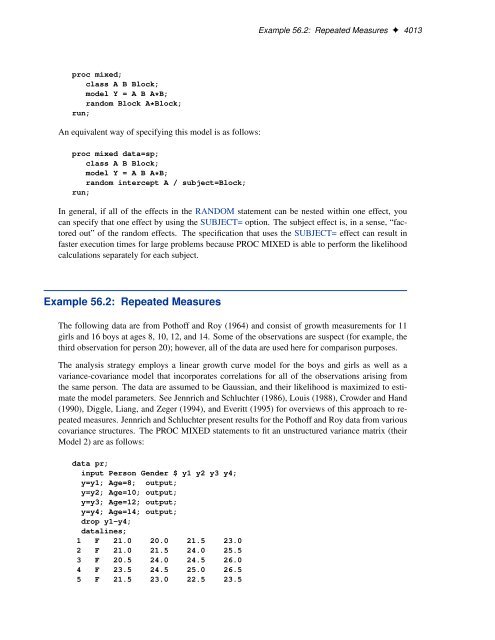
Example 56.2: Repeated Measures<br />
<strong>The</strong> following data are from Pothoff and Roy (1964) and consist of growth measurements for 11<br />
girls and 16 boys at ages 8, 10, 12, and 14. Some of the observations are suspect (for example, the<br />
third observation for person 20); however, all of the data are used here for comparison purposes.<br />
<strong>The</strong> analysis strategy employs a linear growth curve model for the boys and girls as well as a<br />
variance-covariance model that incorporates correlations for all of the observations arising from<br />
the same person. <strong>The</strong> data are assumed to be Gaussian, and their likelihood is maximized to estimate<br />
the model parameters. See Jennrich and Schluchter (1986), Louis (1988), Crowder and Hand<br />
(1990), Diggle, Liang, and Zeger (1994), and Everitt (1995) for overviews of this approach to repeated<br />
measures. Jennrich and Schluchter present results for the Pothoff and Roy data from various<br />
covariance structures. <strong>The</strong> PROC <strong>MIXED</strong> statements to fit an unstructured variance matrix (their<br />
Model 2) are as follows:<br />
data pr;<br />
input Person Gender $ y1 y2 y3 y4;<br />
y=y1; Age=8; output;<br />
y=y2; Age=10; output;<br />
y=y3; Age=12; output;<br />
y=y4; Age=14; output;<br />
drop y1-y4;<br />
datalines;<br />
1 F 21.0 20.0 21.5 23.0<br />
2 F 21.0 21.5 24.0 25.5<br />
3 F 20.5 24.0 24.5 26.0<br />
4 F 23.5 24.5 25.0 26.5<br />
5 F 21.5 23.0 22.5 23.5


