

SAS/STAT 9.2 User's Guide: The MIXED Procedure (Book Excerpt)
SAS/STAT 9.2 User's Guide: The MIXED Procedure (Book Excerpt)
SAS/STAT 9.2 User's Guide: The MIXED Procedure (Book Excerpt)

Create successful ePaper yourself
Turn your PDF publications into a flip-book with our unique Google optimized e-Paper software.
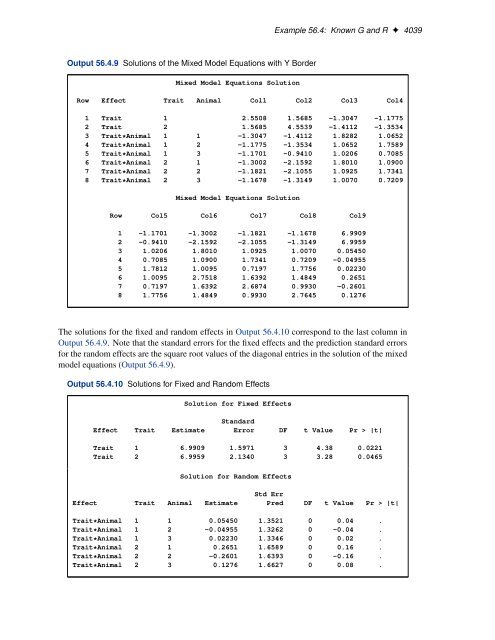
Output 56.4.9 Solutions of the Mixed Model Equations with Y Border<br />
Mixed Model Equations Solution<br />
Example 56.4: Known G and R ✦ 4039<br />
Row Effect Trait Animal Col1 Col2 Col3 Col4<br />
1 Trait 1 2.5508 1.5685 -1.3047 -1.1775<br />
2 Trait 2 1.5685 4.5539 -1.4112 -1.3534<br />
3 Trait*Animal 1 1 -1.3047 -1.4112 1.8282 1.0652<br />
4 Trait*Animal 1 2 -1.1775 -1.3534 1.0652 1.7589<br />
5 Trait*Animal 1 3 -1.1701 -0.9410 1.0206 0.7085<br />
6 Trait*Animal 2 1 -1.3002 -2.1592 1.8010 1.0900<br />
7 Trait*Animal 2 2 -1.1821 -2.1055 1.0925 1.7341<br />
8 Trait*Animal 2 3 -1.1678 -1.3149 1.0070 0.7209<br />
Mixed Model Equations Solution<br />
Row Col5 Col6 Col7 Col8 Col9<br />
1 -1.1701 -1.3002 -1.1821 -1.1678 6.9909<br />
2 -0.9410 -2.1592 -2.1055 -1.3149 6.9959<br />
3 1.0206 1.8010 1.0925 1.0070 0.05450<br />
4 0.7085 1.0900 1.7341 0.7209 -0.04955<br />
5 1.7812 1.0095 0.7197 1.7756 0.02230<br />
6 1.0095 2.7518 1.6392 1.4849 0.2651<br />
7 0.7197 1.6392 2.6874 0.9930 -0.2601<br />
8 1.7756 1.4849 0.9930 2.7645 0.1276<br />
<strong>The</strong> solutions for the fixed and random effects in Output 56.4.10 correspond to the last column in<br />
Output 56.4.9. Note that the standard errors for the fixed effects and the prediction standard errors<br />
for the random effects are the square root values of the diagonal entries in the solution of the mixed<br />
model equations (Output 56.4.9).<br />
Output 56.4.10 Solutions for Fixed and Random Effects<br />
Solution for Fixed Effects<br />
Standard<br />
Effect Trait Estimate Error DF t Value Pr > |t|<br />
Trait 1 6.9909 1.5971 3 4.38 0.0221<br />
Trait 2 6.9959 2.1340 3 3.28 0.0465<br />
Solution for Random Effects<br />
Std Err<br />
Effect Trait Animal Estimate Pred DF t Value Pr > |t|<br />
Trait*Animal 1 1 0.05450 1.3521 0 0.04 .<br />
Trait*Animal 1 2 -0.04955 1.3262 0 -0.04 .<br />
Trait*Animal 1 3 0.02230 1.3346 0 0.02 .<br />
Trait*Animal 2 1 0.2651 1.6589 0 0.16 .<br />
Trait*Animal 2 2 -0.2601 1.6393 0 -0.16 .<br />
Trait*Animal 2 3 0.1276 1.6627 0 0.08 .


