

SAS/STAT 9.2 User's Guide: The MIXED Procedure (Book Excerpt)
SAS/STAT 9.2 User's Guide: The MIXED Procedure (Book Excerpt)
SAS/STAT 9.2 User's Guide: The MIXED Procedure (Book Excerpt)

Create successful ePaper yourself
Turn your PDF publications into a flip-book with our unique Google optimized e-Paper software.
Example 56.7: Influence in Heterogeneous Variance Model ✦ 4055<br />
Example 56.7: Influence in Heterogeneous Variance Model<br />
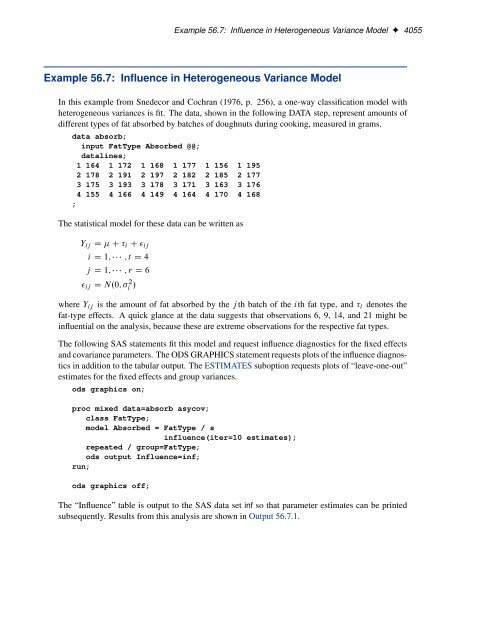
In this example from Snedecor and Cochran (1976, p. 256), a one-way classification model with<br />
heterogeneous variances is fit. <strong>The</strong> data, shown in the following DATA step, represent amounts of<br />
different types of fat absorbed by batches of doughnuts during cooking, measured in grams.<br />
data absorb;<br />
input FatType Absorbed @@;<br />
datalines;<br />
1 164 1 172 1 168 1 177 1 156 1 195<br />
2 178 2 191 2 197 2 182 2 185 2 177<br />
3 175 3 193 3 178 3 171 3 163 3 176<br />
4 155 4 166 4 149 4 164 4 170 4 168<br />
;<br />
<strong>The</strong> statistical model for these data can be written as<br />
Yij D C i C ij<br />
i D 1; ; t D 4<br />
j D 1; ; r D 6<br />
ij D N.0; 2 i /<br />
where Yij is the amount of fat absorbed by the j th batch of the ith fat type, and i denotes the<br />
fat-type effects. A quick glance at the data suggests that observations 6, 9, 14, and 21 might be<br />
influential on the analysis, because these are extreme observations for the respective fat types.<br />
<strong>The</strong> following <strong>SAS</strong> statements fit this model and request influence diagnostics for the fixed effects<br />
and covariance parameters. <strong>The</strong> ODS GRAPHICS statement requests plots of the influence diagnostics<br />
in addition to the tabular output. <strong>The</strong> ESTIMATES suboption requests plots of “leave-one-out”<br />
estimates for the fixed effects and group variances.<br />
ods graphics on;<br />
proc mixed data=absorb asycov;<br />
class FatType;<br />
model Absorbed = FatType / s<br />
influence(iter=10 estimates);<br />
repeated / group=FatType;<br />
ods output Influence=inf;<br />
run;<br />
ods graphics off;<br />
<strong>The</strong> “Influence” table is output to the <strong>SAS</strong> data set inf so that parameter estimates can be printed<br />
subsequently. Results from this analysis are shown in Output 56.7.1.


