- Page 1 and 2:
OFFERING CIRCULAR Offering of 34,45
- Page 3 and 4:
The Combined Offering will be gover
- Page 5 and 6:
neither subject to Section 13 or 15
- Page 7 and 8:
TABLE OF CONTENTS SUMMARY .........
- Page 9 and 10:
SUMMARY This summary should be read
- Page 11 and 12:
GROUP STRUCTURE Arco Vara AS, a com
- Page 13 and 14: to increase the number of new Offer
- Page 15 and 16: SUMMARY OF THE CONSOLIDATED FINANCI
- Page 17 and 18: RISK FACTORS An investment in the O
- Page 19 and 20: In addition, the government and mun
- Page 21 and 22: find changes in customer preference
- Page 23 and 24: from interest rate fluctuations. Se
- Page 25 and 26: Contractual risks A dispute may ari
- Page 27 and 28: staff will increase. Future success
- Page 29 and 30: existing competitive advantages, no
- Page 31 and 32: subject to the discretion of the Co
- Page 33 and 34: their transition process is far fro
- Page 35 and 36: Group fails to achieve new competit
- Page 37 and 38: CANCELLATION OF COMBINED OFFERING T
- Page 39 and 40: By submitting a Purchase Order an i
- Page 41 and 42: Any remaining Offer Shares that can
- Page 43 and 44: Priit Hainoja 15,500 Total 1,550,00
- Page 45 and 46: INSTRUCTIONS TO INVESTORS IN ESTONI
- Page 47 and 48: SUBMISSION OF PURCHASE ORDERS INSTR
- Page 49 and 50: BACKGROUND TO THE COMBINED OFFERING
- Page 51 and 52: USE OF PROCEEDS The aggregate net p
- Page 53 and 54: CAPITALIZATION AND INDEBTEDNESS The
- Page 55 and 56: The International Monetary Fund (IM
- Page 57 and 58: • Class D: Lowest quality office
- Page 59 and 60: The table below compares prime offi
- Page 61 and 62: on apartments. Developers increasin
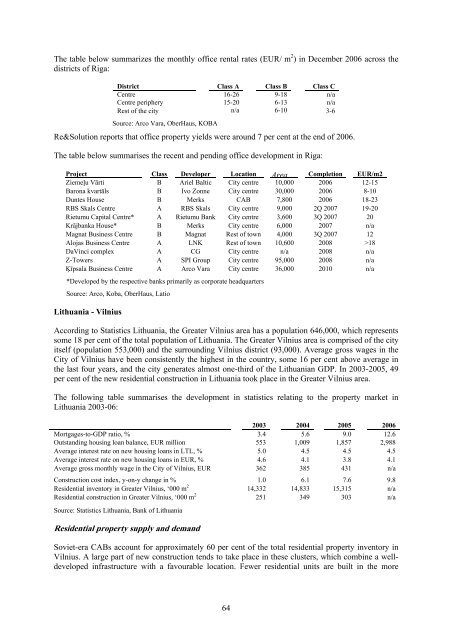
- Page 63: The table below summarises the rece
- Page 67 and 68: The following table summarises the
- Page 69 and 70: 570,000 m 2 between 2003 and 2006,
- Page 71 and 72: Office property market King Sturge
- Page 73 and 74: The following table outlines genera
- Page 75 and 76: Project Consolidated project book v
- Page 77 and 78: originate from the new target marke
- Page 79 and 80: HISTORY The Group was founded in 19
- Page 81 and 82: EEK million 2004 audited % EEK mill
- Page 83 and 84: Country 2004 2005 2006 31 March 200
- Page 85 and 86: Any small scale development project
- Page 87 and 88: Name of the company 2004 (EEK m) 20
- Page 89 and 90: tends to be smoother in Latvia than
- Page 91 and 92: In addition to 21 projects specifie
- Page 93 and 94: project is also expected in 2007. T
- Page 95 and 96: RESIDENTIAL DEVELOPMENT PROJECTS Ti
- Page 97 and 98: Laeva office building project in Ta
- Page 99 and 100: The property in TOP Pirita includes
- Page 101 and 102: Enerpoint office property in Kuress
- Page 103 and 104: The construction division has a sup
- Page 105 and 106: prescribed by IFRS, such investment
- Page 107 and 108: Human resource management principle
- Page 109 and 110: Name / Location Description Intende
- Page 111 and 112: Name / Location Description Intende
- Page 113 and 114: Name / Location Description Intende
- Page 115 and 116:
the Group nor does it consider it l
- Page 117 and 118:
ENVIRONMENTAL ISSUES As a result of
- Page 119 and 120:
The shareholders’ meeting can pas
- Page 121 and 122:
If a party breaches its obligations
- Page 123 and 124:
Shareholders’ agreement in relati
- Page 125 and 126:
transactions of the Group, see Note
- Page 127 and 128:
expiring on 31 December 2007. Inter
- Page 129 and 130:
• Loan agreement between Arco Inv
- Page 131 and 132:
SELECTED FINANCIAL DATA The followi
- Page 133 and 134:
Year ended 31 December Three months
- Page 135 and 136:
ownership structures and disposals
- Page 137 and 138:
a company owned by City of Riga. A
- Page 139 and 140:
The Group’s future development de
- Page 141 and 142:
Year ended 31 December Three months
- Page 143 and 144:
evenue of the division for the firs
- Page 145 and 146:
Total revenue from rental and prope
- Page 147 and 148:
The Group recognised an EEK 7.5 mil
- Page 149 and 150:
Operating expenses Marketing expens
- Page 151 and 152:
were an increase in operating profi
- Page 153 and 154:
As at 31 December 2006, Arco Vara A
- Page 155 and 156:
Revenue from sales of other goods R
- Page 157 and 158:
MANAGEMENT Pursuant to the provisio
- Page 159 and 160:
more than two members, the Supervis
- Page 161 and 162:
Kaido Kangur 1968 Head of Services
- Page 163 and 164:
CORPORATE GOVERNANCE The Estonian F
- Page 165 and 166:
165 Privador AS, Supervisory Counci
- Page 167 and 168:
Each member of the Management Board
- Page 169 and 170:
currently under compulsory liquidat
- Page 171 and 172:
DEVELOPMENT Name % Registered offic
- Page 173 and 174:
CHANGES IN THE SHARE CAPITAL Since
- Page 175 and 176:
For the description of transactions
- Page 177 and 178:
The rights attaching to any class o
- Page 179 and 180:
obligation to make the mandatory ta
- Page 181 and 182:
The supervisory council engages in
- Page 183 and 184:
The public has access to certain in
- Page 185 and 186:
established by law (such permission
- Page 187 and 188:
TAXATION The following summary is b
- Page 189 and 190:
In addition, as the current income
- Page 191 and 192:
FEDERAL TAX CONSIDERATIONS IN UNITE
- Page 193 and 194:
Treaty. For Estonian taxation on ga
- Page 195 and 196:
GENERAL UNDERWRITING The Company an
- Page 197 and 198:
ely upon the truth and accuracy of
- Page 199 and 200:
document in respect of the Offer, u
- Page 201 and 202:
non-U.S. plan, and such acquisition
- Page 203 and 204:
DEFINITIONS AND GLOSSARY “CAB”
- Page 205 and 206:
INDEX TO FINANCIAL STATEMENTS F-1 P
- Page 207 and 208:
CONSOLIDATED INCOME STATEMENT in th
- Page 209 and 210:
CONSOLIDATED CASH FLOW STATEMENT in
- Page 211 and 212:
NOTES TO THE CONSOLIDATED INTERIM C
- Page 213 and 214:
Property, plant and equipment (note
- Page 215 and 216:
The decrease in the volume of the a
- Page 217 and 218:
Disposals related to sale of subsid
- Page 219 and 220:
13 Events after the balance sheet d
- Page 221 and 222:
CONSOLIDATED INCOME STATEMENT in th
- Page 223 and 224:
CONSOLIDATED CASH FLOW STATEMENT in
- Page 225 and 226:
NOTES TO THE CONSOLIDATED FINANCIAL
- Page 227 and 228:
3 Changes in the presentation and a
- Page 229 and 230:
Estimation uncertainty The estimate
- Page 231 and 232:
warranty provisions and other produ
- Page 233 and 234:
Financial Reporting Standards may n
- Page 235 and 236:
Investment property Investment prop
- Page 237 and 238:
Expenses incurred on PPE after thei
- Page 239 and 240:
subsequently measured at amortised
- Page 241 and 242:
Accounting for investments in subsi
- Page 243 and 244:
Segment investments into non-curren
- Page 245 and 246:
Companies belonging to the Arco Var
- Page 247 and 248:
7.2 Changes in the Group's ownershi
- Page 249 and 250:
F-45 1.01.2005 Cash and cash equiva
- Page 251 and 252:
In the autumn of 2006, Pennington K
- Page 253 and 254:
1 Depreciation, amoritzation and im
- Page 255 and 256:
Operating lease: Group as the lesse
- Page 257 and 258:
The net realizable value of invento
- Page 259 and 260:
1 Investments measured at fair valu
- Page 261 and 262:
properties into investment property
- Page 263 and 264:
o Forecasted aggressive growth in r
- Page 265 and 266:
2 Other short-term and long-term lo
- Page 267 and 268:
Total adjustment of revenue 3 903 -
- Page 269 and 270:
32 Contingent liabilities in thousa
- Page 271 and 272:
Risk management in Arco Vara Group
- Page 273 and 274:
Interest-bearing receivables and li
- Page 275 and 276:
35 Cash flows from operating activi
- Page 277 and 278:
2006 2005 Sales revenue 249 1 829 P
- Page 279 and 280:
As a part of the restructuring, the
- Page 281 and 282:
41 Main statements of the Parent as
- Page 283 and 284:
Cash Flow Statement 2006 2005 Cash
- Page 285 and 286:
CONSOLIDATED AUDITED FINANCIAL STAT
- Page 287 and 288:
CONSOLIDATED BALANCE SHEET for the
- Page 289 and 290:
1 In 2005, purchase of investment p
- Page 291 and 292:
2005 2004 Total dividends announced
- Page 293 and 294:
More detailed information of subsid
- Page 295 and 296:
these new / revised standards and i
- Page 297 and 298:
Receivable from local municipalitie
- Page 299 and 300:
agreed, is concluded. Payments rece
- Page 301 and 302:
Interest income from receivables an
- Page 303 and 304:
characteristic (age, sort and level
- Page 305 and 306:
eviewed for impairment when events
- Page 307 and 308:
tax. A Group’s potential tax liab
- Page 309 and 310:
As of 31.12.2004 or for the year 20
- Page 311 and 312:
8 Cost of sales in thousands of kro
- Page 313 and 314:
Weighted average number of ordinary
- Page 315 and 316:
Arco Maadehalduse OÜ Arco Manageme
- Page 317 and 318:
4 In 2005, the Group purchased 20%
- Page 319 and 320:
Cash and cash equivalents -253 Othe
- Page 321 and 322:
19 Long-term receivables in thousan
- Page 323 and 324:
Reclassifications from and to prope
- Page 325 and 326:
Amortisation charge 0 0 -263 -263 I
- Page 327 and 328:
Additional information on borrowing
- Page 329 and 330:
29 Other long-term payables in thou
- Page 331 and 332:
counterparty to be able to use the
- Page 333 and 334:
The amount of cash and cash equival
- Page 335 and 336:
many real estate transactions are f
- Page 337 and 338:
The acquisition of ownership in the
- Page 339 and 340:
38 Main statements of the Parent as
- Page 341 and 342:
Repayments of borrowings -142 693 -
- Page 343 and 344:
Opinion In our opinion, the consoli
- Page 345 and 346:
ANNEX A: COLLIERS INTERNATIONAL APP
- Page 347 and 348:
TABLE OF CONTENTS Instructions Page
- Page 349 and 350:
COMPLIANCE WITH STANDARDS AND STATU
- Page 351 and 352:
VALUATION METHODOLOGIES Discounted
- Page 353 and 354:
SUMMARY All information gathered ha
- Page 355 and 356:
Project Address Cadastral Gross Inc
- Page 357 and 358:
six-storey high 100% office buildin
- Page 359 and 360:
Project Address Cadastral Size, Net
- Page 361 and 362:
[THIS PAGE HAS INTENTIONALLY BEEN L
- Page 363 and 364:
[THIS PAGE HAS INTENTIONALLY BEEN L