Mpumalanga Biodiversity Conservation Plan Handbook - bgis-sanbi
Mpumalanga Biodiversity Conservation Plan Handbook - bgis-sanbi
Mpumalanga Biodiversity Conservation Plan Handbook - bgis-sanbi

You also want an ePaper? Increase the reach of your titles
YUMPU automatically turns print PDFs into web optimized ePapers that Google loves.
MPUMALANGA BIODIVERSITY CONSERVATION PLAN HANDBOOK<br />
14<br />
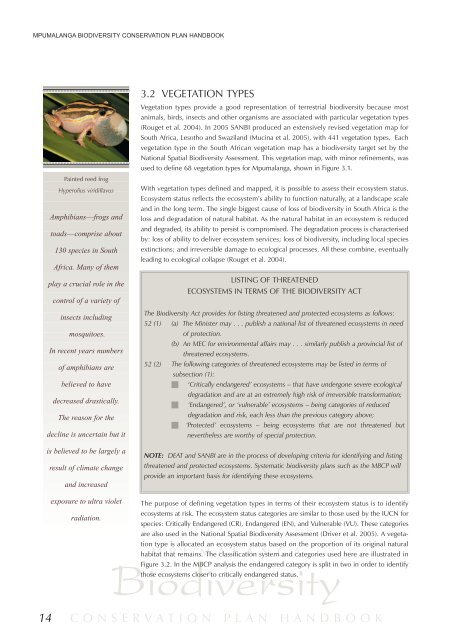
Painted reed frog<br />
Hyperolius viridiflavus<br />
Amphibians––frogs and<br />
toads––comprise about<br />
130 species in South<br />
Africa. Many of them<br />
play a crucial role in the<br />
control of a variety of<br />
insects including<br />
mosquitoes.<br />
In recent years numbers<br />
of amphibians are<br />
believed to have<br />
decreased drastically.<br />
The reason for the<br />
decline is uncertain but it<br />
is believed to be largely a<br />
result of climate change<br />
and increased<br />
exposure to ultra violet<br />
radiation.<br />
3.2 VEGETATION TYPES<br />
Vegetation types provide a good representation of terrestrial biodiversity because most<br />
animals, birds, insects and other organisms are associated with particular vegetation types<br />
(Rouget et al. 2004). In 2005 SANBI produced an extensively revised vegetation map for<br />
South Africa, Lesotho and Swaziland (Mucina et al. 2005), with 441 vegetation types. Each<br />
vegetation type in the South African vegetation map has a biodiversity target set by the<br />
National Spatial <strong>Biodiversity</strong> Assessment. This vegetation map, with minor refinements, was<br />
used to define 68 vegetation types for <strong>Mpumalanga</strong>, shown in Figure 3.1.<br />
With vegetation types defined and mapped, it is possible to assess their ecosystem status.<br />
Ecosystem status reflects the ecosystem’s ability to function naturally, at a landscape scale<br />
and in the long term. The single biggest cause of loss of biodiversity in South Africa is the<br />
loss and degradation of natural habitat. As the natural habitat in an ecosystem is reduced<br />
and degraded, its ability to persist is compromised. The degradation process is characterised<br />
by: loss of ability to deliver ecosystem services; loss of biodiversity, including local species<br />
extinctions; and irreversible damage to ecological processes. All these combine, eventually<br />
leading to ecological collapse (Rouget et al. 2004).<br />
LISTING OF THREATENED<br />
ECOSYSTEMS IN TERMS OF THE BIODIVERSITY ACT<br />
The <strong>Biodiversity</strong> Act provides for listing threatened and protected ecosystems as follows:<br />
52 (1) (a) The Minister may . . . publish a national list of threatened ecosystems in need<br />
of protection.<br />
(b) An MEC for environmental affairs may . . . similarly publish a provincial list of<br />
threatened ecosystems.<br />
52 (2) The following categories of threatened ecosystems may be listed in terms of<br />
subsection (1):<br />
‘Critically endangered’ ecosystems – that have undergone severe ecological<br />
degradation and are at an extremely high risk of irreversible transformation;<br />
‘Endangered’, or ‘vulnerable’ ecosystems – being categories of reduced<br />
degradation and risk, each less than the previous category above;<br />
‘Protected’ ecosystems – being ecosystems that are not threatened but<br />
nevertheless are worthy of special protection.<br />
NOTE: DEAT and SANBI are in the process of developing criteria for identifying and listing<br />
threatened and protected ecosystems. Systematic biodiversity plans such as the MBCP will<br />
provide an important basis for identifying these ecosystems.<br />
The purpose of defining vegetation types in terms of their ecosystem status is to identify<br />
ecosystems at risk. The ecosystem status categories are similar to those used by the IUCN for<br />
species: Critically Endangered (CR), Endangered (EN), and Vulnerable (VU). These categories<br />
are also used in the National Spatial <strong>Biodiversity</strong> Assessment (Driver et al. 2005). A vegetation<br />
type is allocated an ecosystem status based on the proportion of its original natural<br />
M P U M A L A N G A<br />
habitat that remains. The classification system and categories used here are illustrated in<br />
<strong>Biodiversity</strong><br />
Figure 3.2. In the MBCP analysis the endangered category is split in two in order to identify<br />
those ecosystems closer to critically endangered status.<br />
CONSERVATION PLAN HANDBOOK