Mpumalanga Biodiversity Conservation Plan Handbook - bgis-sanbi
Mpumalanga Biodiversity Conservation Plan Handbook - bgis-sanbi
Mpumalanga Biodiversity Conservation Plan Handbook - bgis-sanbi

Create successful ePaper yourself
Turn your PDF publications into a flip-book with our unique Google optimized e-Paper software.
Coetzeestroom/Elands Valley<br />
Dr Hamilton Nature Reserve<br />
Flora Nature Reserve<br />
Hartebeesvlakte<br />
Morgenzon<br />
Nelsberg<br />
Queensriver<br />
Starvation Creek<br />
Tweefontein<br />
Wonderkloof Nature Reserve<br />
Mananga Community Heritage<br />
Mawewe Cattle/Game Project<br />
Mthethomusha NR<br />
Cynthia Letty<br />
Ida Doyer Nature Reserve<br />
Thorncroft Nature Reserve<br />
*IFMCA/Conservancy<br />
*IFMCA<br />
*IFMCA<br />
*IFMCA<br />
*IFMCA<br />
*IFMCA<br />
*IFMCA<br />
*IFMCA/Conservancy<br />
*IFMCA<br />
*IFMCA<br />
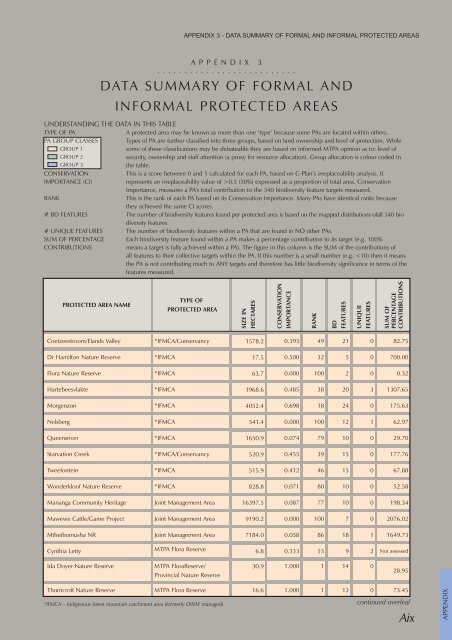
APPENDIX 3 - DATA SUMMARY OF FORMAL AND INFORMAL PROTECTED AREAS<br />
APPENDIX 3<br />
..........................<br />
DATA SUMMARY OF FORMAL AND<br />
INFORMAL PROTECTED AREAS<br />
UNDERSTANDING THE DATA IN THIS TABLE<br />
TYPE OF PA A protected area may be known as more than one ‘type’ because some PAs are located within others.<br />
PA GROUP CLASSES Types of PA are further classified into three groups, based on land ownership and level of protection. While<br />
GROUP 1<br />
some of these classifications may be debateable they are based on informed MTPA opinion as to: level of<br />
GROUP 2<br />
security, ownership and staff attention (a proxy for resource allocation). Group allocation is colour coded in<br />
GROUP 3<br />
the table.<br />
CONSERVATION This is a score between 0 and 1 calculated for each PA, based on C-<strong>Plan</strong>’s irreplaceability analysis. It<br />
IMPORTANCE (CI) represents an irreplaceability value of >0.5 (50%) expressed as a proportion of total area. <strong>Conservation</strong><br />
Importance, measures a PA's total contribution to the 340 biodiversity feature targets measured.<br />
RANK This is the rank of each PA based on its <strong>Conservation</strong> Importance. Many PAs have identical ranks because<br />
they achieved the same CI scores.<br />
# BD FEATURES The number of biodiversity features found per protected area is based on the mapped distributions ofall 340 bio<br />
diversity features.<br />
# UNIQUE FEATURES The number of biodiversity features within a PA that are found in NO other PAs.<br />
SUM OF PERCENTAGE Each biodiversity feature found within a PA makes a percentage contribution to its target (e.g. 100%<br />
CONTRIBUTIONS means a target is fully achieved within a PA). The figure in this column is the SUM of the contributions of<br />
all features to their collective targets within the PA. If this number is a small number (e.g.