Annual Report and Accounts 2012 - Scapa
Annual Report and Accounts 2012 - Scapa
Annual Report and Accounts 2012 - Scapa

Create successful ePaper yourself
Turn your PDF publications into a flip-book with our unique Google optimized e-Paper software.
Directors’ Remuneration <strong>Report</strong> continued<br />
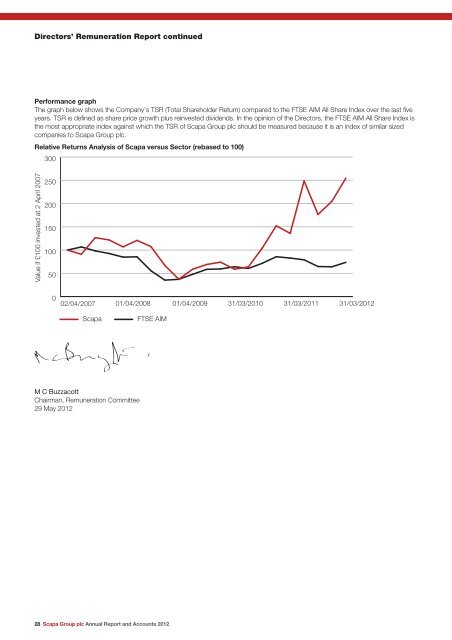
Performance graph<br />
The graph below shows the Company’s TSR (Total Shareholder Return) compared to the FTSE AIM All Share Index over the last five<br />
years. TSR is defined as share price growth plus reinvested dividends. In the opinion of the Directors, the FTSE AIM All Share Index is<br />
the most appropriate index against which the TSR of <strong>Scapa</strong> Group plc should be measured because it is an index of similar sized<br />
companies to <strong>Scapa</strong> Group plc.<br />
Relative Returns Analysis of <strong>Scapa</strong> versus Sector (rebased to 100)<br />
Value if £100 invested at 2 April 2007<br />
300<br />
250<br />
200<br />
150<br />
100<br />
50<br />
0<br />
02/04/2007<br />
01/04/2008<br />
<strong>Scapa</strong> FTSE AIM<br />
M C Buzzacott<br />
Chairman, Remuneration Committee<br />
29 May <strong>2012</strong><br />
28 <strong>Scapa</strong> Group plc <strong>Annual</strong> <strong>Report</strong> <strong>and</strong> <strong>Accounts</strong> <strong>2012</strong><br />
01/04/2009<br />
31/03/2010<br />
31/03/2011<br />
31/03/<strong>2012</strong>