Annual Report and Accounts 2012 - Scapa
Annual Report and Accounts 2012 - Scapa
Annual Report and Accounts 2012 - Scapa
Create successful ePaper yourself
Turn your PDF publications into a flip-book with our unique Google optimized e-Paper software.
Notes on the <strong>Accounts</strong> continued<br />
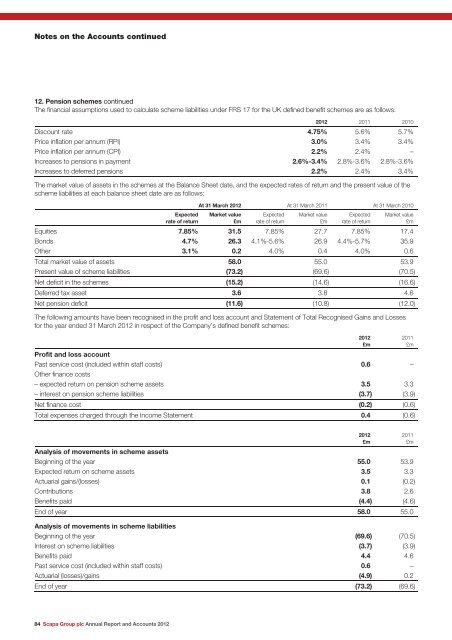
12. Pension schemes continued<br />
The financial assumptions used to calculate scheme liabilities under FRS 17 for the UK defined benefit schemes are as follows:<br />
84 <strong>Scapa</strong> Group plc <strong>Annual</strong> <strong>Report</strong> <strong>and</strong> <strong>Accounts</strong> <strong>2012</strong><br />
<strong>2012</strong> 2011 2010<br />
Discount rate 4.75% 5.6% 5.7%<br />
Price inflation per annum (RPI) 3.0% 3.4% 3.4%<br />
Price inflation per annum (CPI) 2.2% 2.4% –<br />
Increases to pensions in payment 2.6%-3.4% 2.8%-3.6% 2.8%-3.6%<br />
Increases to deferred pensions 2.2% 2.4% 3.4%<br />
The market value of assets in the schemes at the Balance Sheet date, <strong>and</strong> the expected rates of return <strong>and</strong> the present value of the<br />
scheme liabilities at each balance sheet date are as follows:<br />
Expected<br />
rate of return<br />
At 31 March <strong>2012</strong> At 31 March 2011 At 31 March 2010<br />
Market value<br />
£m<br />
Expected<br />
rate of return<br />
Market value<br />
£m<br />
Expected<br />
rate of return<br />
Market value<br />
£m<br />
Equities 7.85% 31.5 7.85% 27.7 7.85% 17.4<br />
Bonds 4.7% 26.3 4.1%-5.6% 26.9 4.4%-5.7% 35.9<br />
Other 3.1% 0.2 4.0% 0.4 4.0% 0.6<br />
Total market value of assets 58.0 55.0 53.9<br />
Present value of scheme liabilities (73.2) (69.6) (70.5)<br />
Net deficit in the schemes (15.2) (14.6) (16.6)<br />
Deferred tax asset 3.6 3.8 4.6<br />
Net pension deficit (11.6) (10.8) (12.0)<br />
The following amounts have been recognised in the profit <strong>and</strong> loss account <strong>and</strong> Statement of Total Recognised Gains <strong>and</strong> Losses<br />
for the year ended 31 March <strong>2012</strong> in respect of the Company’s defined benefit schemes:<br />
Profit <strong>and</strong> loss account<br />
Past service cost (included within staff costs)<br />
Other finance costs<br />
0.6 –<br />
– expected return on pension scheme assets 3.5 3.3<br />
– interest on pension scheme liabilities (3.7) (3.9)<br />
Net finance cost (0.2) (0.6)<br />
Total expenses charged through the Income Statement 0.4 (0.6)<br />
Analysis of movements in scheme assets<br />
Beginning of the year 55.0 53.9<br />
Expected return on scheme assets 3.5 3.3<br />
Actuarial gains/(losses) 0.1 (0.2)<br />
Contributions 3.8 2.6<br />
Benefits paid (4.4) (4.6)<br />
End of year 58.0 55.0<br />
Analysis of movements in scheme liabilities<br />
Beginning of the year (69.6) (70.5)<br />
Interest on scheme liabilities (3.7) (3.9)<br />
Benefits paid 4.4 4.6<br />
Past service cost (included within staff costs) 0.6 –<br />
Actuarial (losses)/gains (4.9) 0.2<br />
End of year (73.2) (69.6)<br />
<strong>2012</strong><br />
£m<br />
<strong>2012</strong><br />
£m<br />
2011<br />
£m<br />
2011<br />
£m


