Annual Report and Accounts 2012 - Scapa
Annual Report and Accounts 2012 - Scapa
Annual Report and Accounts 2012 - Scapa

Create successful ePaper yourself
Turn your PDF publications into a flip-book with our unique Google optimized e-Paper software.
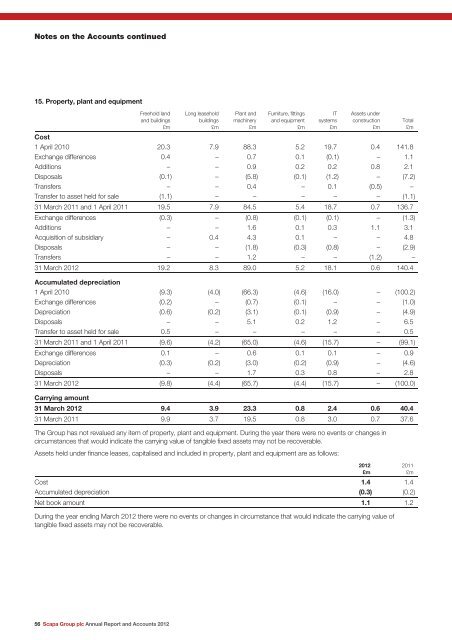
Notes on the <strong>Accounts</strong> continued<br />
15. Property, plant <strong>and</strong> equipment<br />
Freehold l<strong>and</strong><br />
<strong>and</strong> buildings<br />
£m<br />
56 <strong>Scapa</strong> Group plc <strong>Annual</strong> <strong>Report</strong> <strong>and</strong> <strong>Accounts</strong> <strong>2012</strong><br />
Long leasehold<br />
buildings<br />
£m<br />
Plant <strong>and</strong><br />
machinery<br />
£m<br />
Furniture, fittings<br />
<strong>and</strong> equipment<br />
£m<br />
IT<br />
systems<br />
£m<br />
Assets under<br />
construction<br />
£m<br />
Cost<br />
1 April 2010 20.3 7.9 88.3 5.2 19.7 0.4 141.8<br />
Exchange differences 0.4 – 0.7 0.1 (0.1) – 1.1<br />
Additions – – 0.9 0.2 0.2 0.8 2.1<br />
Disposals (0.1) – (5.8) (0.1) (1.2) – (7.2)<br />
Transfers – – 0.4 – 0.1 (0.5) –<br />
Transfer to asset held for sale (1.1) – – – – – (1.1)<br />
31 March 2011 <strong>and</strong> 1 April 2011 19.5 7.9 84.5 5.4 18.7 0.7 136.7<br />
Exchange differences (0.3) – (0.8) (0.1) (0.1) – (1.3)<br />
Additions – – 1.6 0.1 0.3 1.1 3.1<br />
Acquisition of subsidiary – 0.4 4.3 0.1 – – 4.8<br />
Disposals – – (1.8) (0.3) (0.8) – (2.9)<br />
Transfers – – 1.2 – – (1.2) –<br />
31 March <strong>2012</strong> 19.2 8.3 89.0 5.2 18.1 0.6 140.4<br />
Accumulated depreciation<br />
1 April 2010 (9.3) (4.0) (66.3) (4.6) (16.0) – (100.2)<br />
Exchange differences (0.2) – (0.7) (0.1) – – (1.0)<br />
Depreciation (0.6) (0.2) (3.1) (0.1) (0.9) – (4.9)<br />
Disposals – – 5.1 0.2 1.2 – 6.5<br />
Transfer to asset held for sale 0.5 – – – – – 0.5<br />
31 March 2011 <strong>and</strong> 1 April 2011 (9.6) (4.2) (65.0) (4.6) (15.7) – (99.1)<br />
Exchange differences 0.1 – 0.6 0.1 0.1 – 0.9<br />
Depreciation (0.3) (0.2) (3.0) (0.2) (0.9) – (4.6)<br />
Disposals – – 1.7 0.3 0.8 – 2.8<br />
31 March <strong>2012</strong> (9.8) (4.4) (65.7) (4.4) (15.7) – (100.0)<br />
Carrying amount<br />
31 March <strong>2012</strong> 9.4 3.9 23.3 0.8 2.4 0.6 40.4<br />
31 March 2011 9.9 3.7 19.5 0.8 3.0 0.7 37.6<br />
The Group has not revalued any item of property, plant <strong>and</strong> equipment. During the year there were no events or changes in<br />
circumstances that would indicate the carrying value of tangible fixed assets may not be recoverable.<br />
Assets held under finance leases, capitalised <strong>and</strong> included in property, plant <strong>and</strong> equipment are as follows:<br />
Cost 1.4 1.4<br />
Accumulated depreciation (0.3) (0.2)<br />
Net book amount 1.1 1.2<br />
During the year ending March <strong>2012</strong> there were no events or changes in circumstance that would indicate the carrying value of<br />
tangible fixed assets may not be recoverable.<br />
<strong>2012</strong><br />
£m<br />
Total<br />
£m<br />
2011<br />
£m