Annual Report and Accounts 2012 - Scapa
Annual Report and Accounts 2012 - Scapa
Annual Report and Accounts 2012 - Scapa

You also want an ePaper? Increase the reach of your titles
YUMPU automatically turns print PDFs into web optimized ePapers that Google loves.
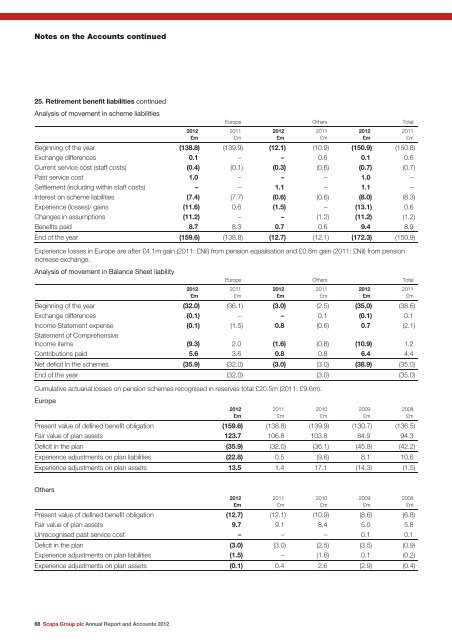
Notes on the <strong>Accounts</strong> continued<br />
25. Retirement benefit liabilities continued<br />
Analysis of movement in scheme liabilities<br />
68 <strong>Scapa</strong> Group plc <strong>Annual</strong> <strong>Report</strong> <strong>and</strong> <strong>Accounts</strong> <strong>2012</strong><br />
<strong>2012</strong><br />
£m<br />
Europe Others Total<br />
Beginning of the year (138.8) (139.9) (12.1) (10.9) (150.9) (150.8)<br />
Exchange differences 0.1 – – 0.6 0.1 0.6<br />
Current service cost (staff costs) (0.4) (0.1) (0.3) (0.6) (0.7) (0.7)<br />
Past service cost 1.0 – – – 1.0 –<br />
Settlement (including within staff costs) – – 1.1 – 1.1 –<br />
Interest on scheme liabilities (7.4) (7.7) (0.6) (0.6) (8.0) (8.3)<br />
Experience (losses)/ gains (11.6) 0.6 (1.5) – (13.1) 0.6<br />
Changes in assumptions (11.2) – – (1.2) (11.2) (1.2)<br />
Benefits paid 8.7 8.3 0.7 0.6 9.4 8.9<br />
End of the year (159.6) (138.8) (12.7) (12.1) (172.3) (150.9)<br />
Experience losses in Europe are after £4.1m gain (2011: £Nil) from pension equalisation <strong>and</strong> £0.8m gain (2011: £Nil) from pension<br />
increase exchange.<br />
Analysis of movement in Balance Sheet liability<br />
Europe Others Total<br />
<strong>2012</strong><br />
£m<br />
Beginning of the year (32.0) (36.1) (3.0) (2.5) (35.0) (38.6)<br />
Exchange differences (0.1) – – 0.1 (0.1) 0.1<br />
Income Statement expense<br />
Statement of Comprehensive<br />
(0.1) (1.5) 0.8 (0.6) 0.7 (2.1)<br />
Income items (9.3) 2.0 (1.6) (0.8) (10.9) 1.2<br />
Contributions paid 5.6 3.6 0.8 0.8 6.4 4.4<br />
Net deficit in the schemes (35.9) (32.0) (3.0) (3.0) (38.9) (35.0)<br />
End of the year (32.0) (3.0) (35.0)<br />
Cumulative actuarial losses on pension schemes recognised in reserves total £20.5m (2011: £9.6m).<br />
Europe<br />
<strong>2012</strong><br />
2011<br />
2010<br />
2009<br />
2008<br />
£m<br />
£m<br />
£m<br />
£m<br />
£m<br />
Present value of defined benefit obligation (159.6) (138.8) (139.9) (130.7) (136.5)<br />
Fair value of plan assets 123.7 106.8 103.8 84.9 94.3<br />
Deficit in the plan (35.9) (32.0) (36.1) (45.8) (42.2)<br />
Experience adjustments on plan liabilities (22.8) 0.5 (9.6) 8.1 10.6<br />
Experience adjustments on plan assets 13.5 1.4 17.1 (14.3) (1.5)<br />
Others<br />
Present value of defined benefit obligation (12.7) (12.1) (10.9) (8.6) (6.8)<br />
Fair value of plan assets 9.7 9.1 8.4 5.0 5.8<br />
Unrecognised past service cost – – – 0.1 0.1<br />
Deficit in the plan (3.0) (3.0) (2.5) (3.5) (0.9)<br />
Experience adjustments on plan liabilities (1.5) – (1.6) 0.1 (0.2)<br />
Experience adjustments on plan assets (0.1) 0.4 2.6 (2.9) (0.4)<br />
2011<br />
£m<br />
2011<br />
£m<br />
<strong>2012</strong><br />
£m<br />
<strong>2012</strong><br />
£m<br />
<strong>2012</strong><br />
£m<br />
2011<br />
£m<br />
2011<br />
£m<br />
2011<br />
£m<br />
2010<br />
£m<br />
<strong>2012</strong><br />
£m<br />
<strong>2012</strong><br />
£m<br />
2009<br />
£m<br />
2011<br />
£m<br />
2011<br />
£m<br />
2008<br />
£m