Annual Report and Accounts 2012 - Scapa
Annual Report and Accounts 2012 - Scapa
Annual Report and Accounts 2012 - Scapa

You also want an ePaper? Increase the reach of your titles
YUMPU automatically turns print PDFs into web optimized ePapers that Google loves.
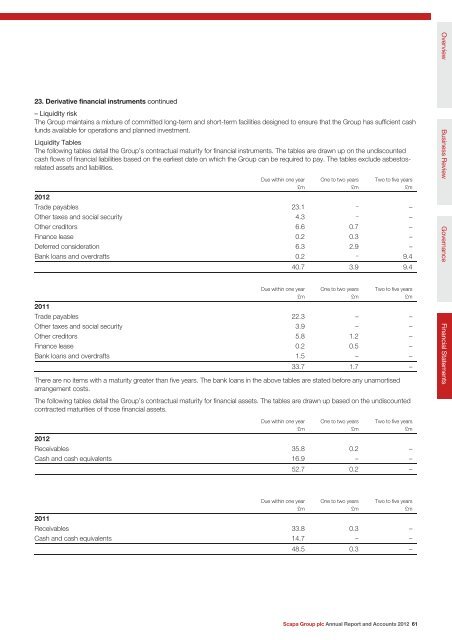
23. Derivative financial instruments continued<br />
– Liquidity risk<br />
The Group maintains a mixture of committed long-term <strong>and</strong> short-term facilities designed to ensure that the Group has sufficient cash<br />
funds available for operations <strong>and</strong> planned investment.<br />
Liquidity Tables<br />
The following tables detail the Group’s contractual maturity for financial instruments. The tables are drawn up on the undiscounted<br />
cash flows of financial liabilities based on the earliest date on which the Group can be required to pay. The tables exclude asbestosrelated<br />
assets <strong>and</strong> liabilities.<br />
Due within one year<br />
£m<br />
One to two years<br />
£m<br />
Two to five years<br />
£m<br />
<strong>2012</strong><br />
Trade payables 23.1 – –<br />
Other taxes <strong>and</strong> social security 4.3 – –<br />
Other creditors 6.6 0.7 –<br />
Finance lease 0.2 0.3 –<br />
Deferred consideration 6.3 2.9 –<br />
Bank loans <strong>and</strong> overdrafts 0.2 – 9.4<br />
Due within one year<br />
£m<br />
40.7 3.9 9.4<br />
One to two years<br />
£m<br />
Two to five years<br />
£m<br />
2011<br />
Trade payables 22.3 – –<br />
Other taxes <strong>and</strong> social security 3.9 – –<br />
Other creditors 5.8 1.2 –<br />
Finance lease 0.2 0.5 –<br />
Bank loans <strong>and</strong> overdrafts 1.5 – –<br />
33.7 1.7 –<br />
There are no items with a maturity greater than five years. The bank loans in the above tables are stated before any unamortised<br />
arrangement costs.<br />
The following tables detail the Group’s contractual maturity for financial assets. The tables are drawn up based on the undiscounted<br />
contracted maturities of those financial assets.<br />
Due within one year<br />
£m<br />
One to two years<br />
£m<br />
Two to five years<br />
£m<br />
<strong>2012</strong><br />
Receivables 35.8 0.2 –<br />
Cash <strong>and</strong> cash equivalents 16.9 – –<br />
Due within one year<br />
£m<br />
52.7 0.2 –<br />
One to two years<br />
£m<br />
Two to five years<br />
£m<br />
2011<br />
Receivables 33.8 0.3 –<br />
Cash <strong>and</strong> cash equivalents 14.7 – –<br />
48.5 0.3 –<br />
<strong>Scapa</strong> Group plc <strong>Annual</strong> <strong>Report</strong> <strong>and</strong> <strong>Accounts</strong> <strong>2012</strong> 61<br />
Overview Business Review<br />
Governance<br />
Financial Statements