Annual Report and Accounts 2012 - Scapa
Annual Report and Accounts 2012 - Scapa
Annual Report and Accounts 2012 - Scapa

You also want an ePaper? Increase the reach of your titles
YUMPU automatically turns print PDFs into web optimized ePapers that Google loves.
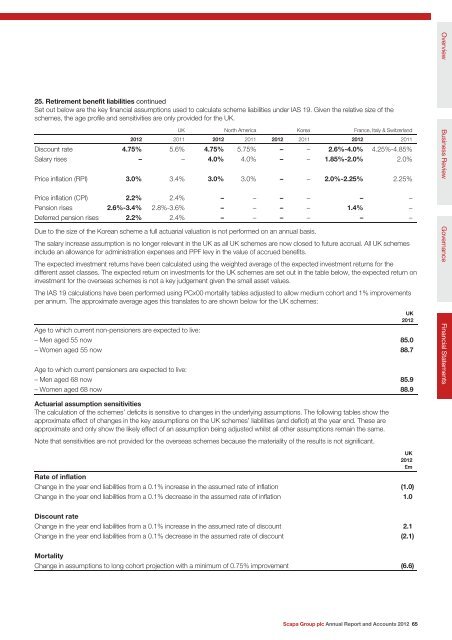
25. Retirement benefit liabilities continued<br />
Set out below are the key financial assumptions used to calculate scheme liabilities under IAS 19. Given the relative size of the<br />
schemes, the age profile <strong>and</strong> sensitivities are only provided for the UK.<br />
UK North America Korea France, Italy & Switzerl<strong>and</strong><br />
<strong>2012</strong> 2011 <strong>2012</strong> 2011 <strong>2012</strong> 2011 <strong>2012</strong> 2011<br />
Discount rate 4.75% 5.6% 4.75% 5.75% – – 2.6%-4.0% 4.25%-4.85%<br />
Salary rises – – 4.0% 4.0% – – 1.85%-2.0% 2.0%<br />
Price inflation (RPI) 3.0% 3.4% 3.0% 3.0% – – 2.0%-2.25% 2.25%<br />
Price inflation (CPI) 2.2% 2.4% – – – – – –<br />
Pension rises 2.6%-3.4% 2.8%-3.6% – – – – 1.4% –<br />
Deferred pension rises 2.2% 2.4% – – – – – –<br />
Due to the size of the Korean scheme a full actuarial valuation is not performed on an annual basis.<br />
The salary increase assumption is no longer relevant in the UK as all UK schemes are now closed to future accrual. All UK schemes<br />
include an allowance for administration expenses <strong>and</strong> PPF levy in the value of accrued benefits.<br />
The expected investment returns have been calculated using the weighted average of the expected investment returns for the<br />
different asset classes. The expected return on investments for the UK schemes are set out in the table below, the expected return on<br />
investment for the overseas schemes is not a key judgement given the small asset values.<br />
The IAS 19 calculations have been performed using PCx00 mortality tables adjusted to allow medium cohort <strong>and</strong> 1% improvements<br />
per annum. The approximate average ages this translates to are shown below for the UK schemes:<br />
UK<br />
<strong>2012</strong><br />
Age to which current non-pensioners are expected to live:<br />
– Men aged 55 now 85.0<br />
– Women aged 55 now 88.7<br />
Age to which current pensioners are expected to live:<br />
– Men aged 68 now 85.9<br />
– Women aged 68 now 88.9<br />
Actuarial assumption sensitivities<br />
The calculation of the schemes’ deficits is sensitive to changes in the underlying assumptions. The following tables show the<br />
approximate effect of changes in the key assumptions on the UK schemes’ liabilities (<strong>and</strong> deficit) at the year end. These are<br />
approximate <strong>and</strong> only show the likely effect of an assumption being adjusted whilst all other assumptions remain the same.<br />
Note that sensitivities are not provided for the overseas schemes because the materiality of the results is not significant.<br />
UK<br />
<strong>2012</strong><br />
£m<br />
Rate of inflation<br />
Change in the year end liabilities from a 0.1% increase in the assumed rate of inflation (1.0)<br />
Change in the year end liabilities from a 0.1% decrease in the assumed rate of inflation 1.0<br />
Discount rate<br />
Change in the year end liabilities from a 0.1% increase in the assumed rate of discount 2.1<br />
Change in the year end liabilities from a 0.1% decrease in the assumed rate of discount (2.1)<br />
Mortality<br />
Change in assumptions to long cohort projection with a minimum of 0.75% improvement (6.6)<br />
<strong>Scapa</strong> Group plc <strong>Annual</strong> <strong>Report</strong> <strong>and</strong> <strong>Accounts</strong> <strong>2012</strong> 65<br />
Overview Business Review<br />
Governance<br />
Financial Statements