- Page 1 and 2: European Commission 2000 CARDS Prog
- Page 4 and 5: ! " # $ % &' ( ) * + # ' ( , " ! &
- Page 6 and 7: !" # $ $ $%& 7 9 7 7 9 1 & 7 9 ! /
- Page 8 and 9: !" # $ $ $%& The Regional Balkans I
- Page 10 and 11: , !" # $ $ $%& Traffic in the regio
- Page 12 and 13: !" # $ $ $%& waiting times and unpr
- Page 14 and 15: 1.200 1.000 800 600 400 200 Airport
- Page 16 and 17: !" # $ $ $%& Another potential - an
- Page 18 and 19: !" # $ $ $%& Navigability on the ri
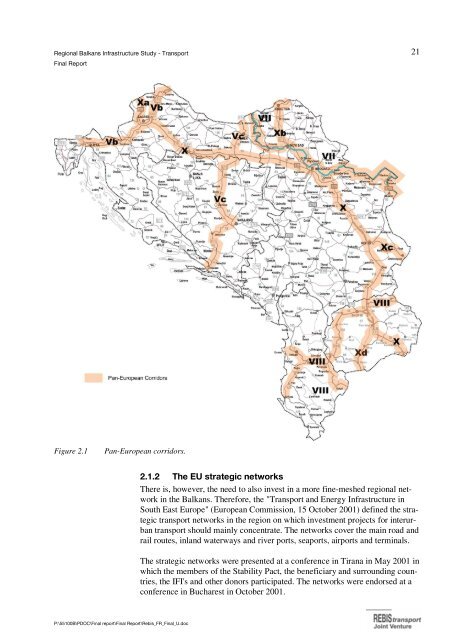
- Page 20 and 21: !" # $ $ $%& The European Union pla
- Page 22 and 23: !" # $ $ $%& RELEX), of the interna
- Page 26 and 27: !" # $ $ $%& ,, + 0 " $ TIRS elabor
- Page 28 and 29: Figure 2.3 Proposed core rail netwo
- Page 30 and 31: !" # $ $ $%& when it is completed.
- Page 32 and 33: Figure 2.6 Routes and corridors, ra
- Page 34 and 35: Figure 2.7 Road geometry. !" # $ $
- Page 36 and 37: !" # $ $ $%& • 86% of the network
- Page 38 and 39: !" # $ $ $%& The border crossings o
- Page 40 and 41: Figure 2.11 Rail border crossings o
- Page 42 and 43: !" # $ $ $%& The border crossings o
- Page 44 and 45: !" # $ $ $%& Improvement of facilit
- Page 46 and 47: Table 2.7 Border crossings on the c
- Page 48 and 49: Figure 2.12 Projected road traffic
- Page 50 and 51: Figure 2.14 Projected rail freight
- Page 52 and 53: Table 2.8 Assumptions about annual
- Page 54 and 55: 100% 80% 60% 40% 20% 0% Croatia 11%
- Page 56 and 57: !" # $ $ $%& Table 2.10 Growth rate
- Page 58 and 59: , !" # $ $ $%& One of the main aims
- Page 60 and 61: Figure 3.1 The planning process. ,
- Page 62 and 63: !" # $ $ $%& Table 3.1 Long-term in
- Page 64 and 65: !" # $ $ $%& • the capacity of th
- Page 66 and 67: !" # $ $ $%& • the nominal minimu
- Page 68 and 69: !" # $ $ $%& have provided informat
- Page 70 and 71: !" # $ $ $%& The road border crossi
- Page 72 and 73: !" # $ $ $%& plementation can start
- Page 74 and 75:
!" # $ $ $%& Figure 3.6 Example of
- Page 76 and 77:
!" # $ $ $%& Within each mode categ
- Page 78 and 79:
!" # $ $ $%& Most of the highest ra
- Page 80 and 81:
!" # $ $ $%& The results of the pre
- Page 82 and 83:
!" # $ $ $%& Cr-H-02abc: Upgrade fr
- Page 84 and 85:
!" # $ $ $%& Ma-R-10n: Up-grading o
- Page 86 and 87:
!" # $ $ $%& Yu-R-07: Repair of Dan
- Page 88 and 89:
!" # $ $ $%& YU-H-35N: Bypass Bijel
- Page 90 and 91:
!" # $ $ $%& tendering and construc
- Page 92 and 93:
Figure 3.12 Location of ongoing, co
- Page 94 and 95:
Project N° Project Name Corridor/
- Page 96 and 97:
!" # $ $ $%& Table 3.7 Total invest
- Page 98 and 99:
!" # $ $ $%& Table 3.8 Distribution
- Page 100 and 101:
!" # $ $ $%& struction works (EUR 4
- Page 102 and 103:
Million Eur 600 500 400 300 200 100
- Page 104 and 105:
Table 3.14 Investment costs and GDP
- Page 106 and 107:
!" # $ $ $%& Major investments are
- Page 108 and 109:
!" # $ $ $%& , ! In Western Europe,
- Page 110 and 111:
!" # $ $ $%& ,, + $ Historically, b
- Page 112 and 113:
!" # $ $ $%& ments, which include a
- Page 114 and 115:
!" # $ $ $%& govina Dept. of Civil
- Page 116 and 117:
!" # $ $ $%& data collection to all
- Page 118 and 119:
! ' /! ' /! /! ' /! > 7 B B ! > ( (
- Page 120 and 121:
! 0 & " # " ( ( ( G + & + # + 3 3&
- Page 122 and 123:
0 & " # + > + @ + + (( (( 3 3 & !"
- Page 124 and 125:
!" # $ $ $%& inventory data are nec
- Page 126 and 127:
!" # $ $ $%& ,, $ " Both Croatia an
- Page 128 and 129:
!" # $ $ $%& The first day gave a g
- Page 130 and 131:
!" # $ $ $%& In this chapter the ex
- Page 132 and 133:
Table 5.2 Examples of charges (2002
- Page 134 and 135:
!" # $ $ $%& The countries' present
- Page 136 and 137:
!" # $ $ $%& • what portion of th
- Page 138 and 139:
!" # $ $ $%& cost estimated and ass
- Page 140 and 141:
, !" # $ $ $%& $ " $ The railway se
- Page 142 and 143:
!" # $ $ $%& The overall staff in t
- Page 144 and 145:
!" # $ $ $%& As shown in the above
- Page 146 and 147:
!" # $ $ $%& ,, ! " ! 0 $ Past traf
- Page 148 and 149:
!" # $ $ $%& Perspectives for passe
- Page 150 and 151:
!" # $ $ $%& The following diagram
- Page 152 and 153:
!" # $ $ $%& Montenegro (ZCG) Serbi
- Page 154 and 155:
!" # $ $ $%& To reverse this trend,
- Page 156 and 157:
!" # $ $ $%& better scheduling of t
- Page 158 and 159:
%, 7 $ !" # $ $ $%& %,, 3 $ 0 ! The
- Page 160 and 161:
!" # $ $ $%& The performance of the
- Page 162 and 163:
!" # $ $ $%& eration of the termina
- Page 164 and 165:
!" # $ $ $%& Current traffic flows
- Page 166 and 167:
!" # $ $ $%& tially composed of chr
- Page 168 and 169:
Figure 7.1 Main terminal and traffi
- Page 170 and 171:
!" # $ $ $%& The market study shoul
- Page 172 and 173:
!" # $ $ $%& The adaptation to a fr
- Page 174 and 175:
!" # $ $ $%& The study should be ba
- Page 176 and 177:
!" # $ $ $%& This chapter documents
- Page 178 and 179:
!" # $ $ $%& dapest. The VIc class
- Page 180 and 181:
!" # $ $ $%& and 2003. Croatia has
- Page 182 and 183:
!" # $ $ $%& • to decide on the f
- Page 184 and 185:
!" # $ $ $%& So far, a comprehensiv
- Page 186 and 187:
!" # $ $ $%& ) * ! This chapter pro
- Page 188 and 189:
!" # $ $ $%& ),, * The port of Rije
- Page 190 and 191:
!" # $ $ $%& The Port is commercial
- Page 192 and 193:
!" # $ $ $%& The key results were p
- Page 194 and 195:
!" # $ $ $%& • the transport stra
- Page 196 and 197:
!" # $ $ $%& links, ensuring compat
- Page 198 and 199:
!" # $ $ $%& The database is develo
- Page 200 and 201:
!" # $ $ $%& • Section A: Identif
- Page 202 and 203:
!" # $ $ $%& ,,% > ! The database p
- Page 204 and 205:
!" # $ $ $%& By using the buttons o