Ben-Gurion University of the Negev
Ben-Gurion University of the Negev
Ben-Gurion University of the Negev

You also want an ePaper? Increase the reach of your titles
YUMPU automatically turns print PDFs into web optimized ePapers that Google loves.
28<br />
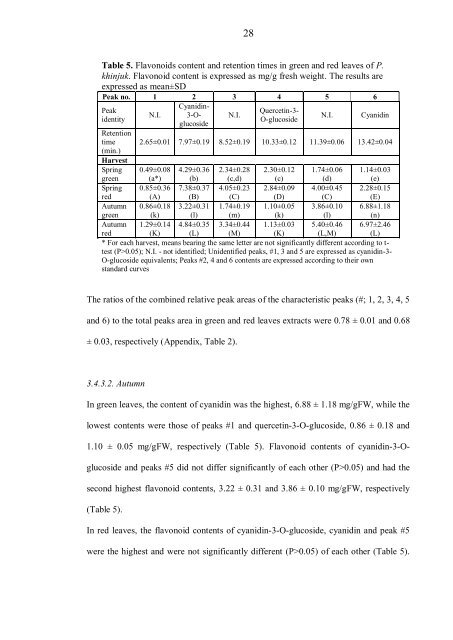
Table 5. Flavonoids content and retention times in green and red leaves <strong>of</strong> P.<br />
khinjuk. Flavonoid content is expressed as mg/g fresh weight. The results are<br />
expressed as mean±SD<br />
Peak no. 1 2 3 4 5 6<br />
Peak<br />
identity<br />
Retention<br />
time<br />
(min.)<br />
Harvest<br />
Spring<br />
green<br />
Spring<br />
red<br />
Autumn<br />
green<br />
Autumn<br />
N.I.<br />
Cyanidin-<br />
3-Oglucoside<br />
N.I.<br />
Quercetin-3-<br />
O-glucoside<br />
N.I. Cyanidin<br />
2.65±0.01 7.97±0.19 8.52±0.19 10.33±0.12 11.39±0.06 13.42±0.04<br />
0.49±0.08 4.29±0.36 2.34±0.28 2.30±0.12 1.74±0.06 1.14±0.03<br />
(a*) (b) (c,d) (c)<br />
(d)<br />
(e)<br />
0.85±0.36 7.38±0.37 4.05±0.23 2.84±0.09 4.00±0.45 2.28±0.15<br />
(A) (B) (C) (D) (C) (E)<br />
0.86±0.18 3.22±0.31 1.74±0.19 1.10±0.05 3.86±0.10 6.88±1.18<br />
(k) (l) (m) (k)<br />
(l)<br />
(n)<br />
1.29±0.14 4.84±0.35 3.34±0.44 1.13±0.03 5.40±0.46 6.97±2.46<br />
red (K) (L) (M) (K) (L,M) (L)<br />
* For each harvest, means bearing <strong>the</strong> same letter are not significantly different according to ttest<br />
(P>0.05); N.I. - not identified; Unidentified peaks, #1, 3 and 5 are expressed as cyanidin-3-<br />
O-glucoside equivalents; Peaks #2, 4 and 6 contents are expressed according to <strong>the</strong>ir own<br />
standard curves<br />
The ratios <strong>of</strong> <strong>the</strong> combined relative peak areas <strong>of</strong> <strong>the</strong> characteristic peaks (#; 1, 2, 3, 4, 5<br />
and 6) to <strong>the</strong> total peaks area in green and red leaves extracts were 0.78 ± 0.01 and 0.68<br />
± 0.03, respectively (Appendix, Table 2).<br />
3.4.3.2. Autumn<br />
In green leaves, <strong>the</strong> content <strong>of</strong> cyanidin was <strong>the</strong> highest, 6.88 ± 1.18 mg/gFW, while <strong>the</strong><br />
lowest contents were those <strong>of</strong> peaks #1 and quercetin-3-O-glucoside, 0.86 ± 0.18 and<br />
1.10 ± 0.05 mg/gFW, respectively (Table 5). Flavonoid contents <strong>of</strong> cyanidin-3-O-<br />
glucoside and peaks #5 did not differ significantly <strong>of</strong> each o<strong>the</strong>r (P>0.05) and had <strong>the</strong><br />
second highest flavonoid contents, 3.22 ± 0.31 and 3.86 ± 0.10 mg/gFW, respectively<br />
(Table 5).<br />
In red leaves, <strong>the</strong> flavonoid contents <strong>of</strong> cyanidin-3-O-glucoside, cyanidin and peak #5<br />
were <strong>the</strong> highest and were not significantly different (P>0.05) <strong>of</strong> each o<strong>the</strong>r (Table 5).