Ben-Gurion University of the Negev
Ben-Gurion University of the Negev
Ben-Gurion University of the Negev

Create successful ePaper yourself
Turn your PDF publications into a flip-book with our unique Google optimized e-Paper software.
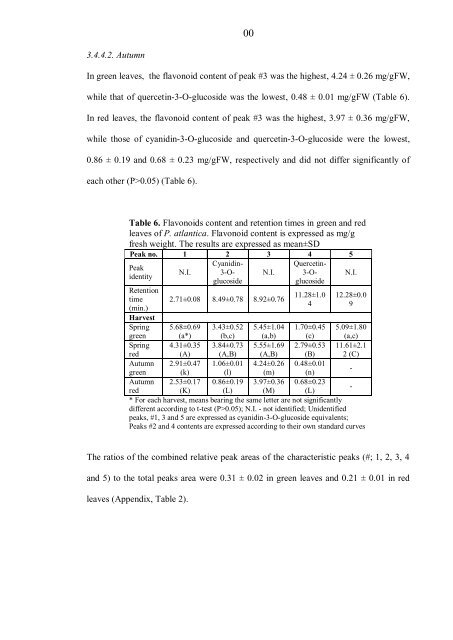
3.4.4.2. Autumn<br />
00<br />
In green leaves, <strong>the</strong> flavonoid content <strong>of</strong> peak #3 was <strong>the</strong> highest, 4.24 ± 0.26 mg/gFW,<br />
while that <strong>of</strong> quercetin-3-O-glucoside was <strong>the</strong> lowest, 0.48 ± 0.01 mg/gFW (Table 6).<br />
In red leaves, <strong>the</strong> flavonoid content <strong>of</strong> peak #3 was <strong>the</strong> highest, 3.97 ± 0.36 mg/gFW,<br />
while those <strong>of</strong> cyanidin-3-O-glucoside and quercetin-3-O-glucoside were <strong>the</strong> lowest,<br />
0.86 ± 0.19 and 0.68 ± 0.23 mg/gFW, respectively and did not differ significantly <strong>of</strong><br />
each o<strong>the</strong>r (P>0.05) (Table 6).<br />
Table 6. Flavonoids content and retention times in green and red<br />
leaves <strong>of</strong> P. atlantica. Flavonoid content is expressed as mg/g<br />
fresh weight. The results are expressed as mean±SD<br />
Peak no. 1 2 3 4 5<br />
Peak<br />
identity<br />
Retention<br />
time<br />
(min.)<br />
Harvest<br />
Spring<br />
green<br />
Spring<br />
red<br />
Autumn<br />
green<br />
Autumn<br />
N.I.<br />
Cyanidin-<br />
3-Oglucoside<br />
N.I.<br />
2.71±0.08 8.49±0.78 8.92±0.76<br />
Quercetin-<br />
3-Oglucoside<br />
11.28±1.0<br />
4<br />
N.I.<br />
12.28±0.0<br />
9<br />
5.68±0.69 3.43±0.52 5.45±1.04 1.70±0.45 5.09±1.80<br />
(a*) (b,c) (a,b) (c) (a,c)<br />
4.31±0.35 3.84±0.73 5.55±1.69 2.79±0.53 11.61±2.1<br />
(A) (A,B) (A,B) (B) 2 (C)<br />
2.91±0.47<br />
(k)<br />
1.06±0.01<br />
(l)<br />
4.24±0.26<br />
(m)<br />
0.48±0.01<br />
(n)<br />
-<br />
red<br />
2.53±0.17<br />
(K)<br />
0.86±0.19<br />
(L)<br />
3.97±0.36<br />
(M)<br />
0.68±0.23<br />
(L)<br />
-<br />
* For each harvest, means bearing <strong>the</strong> same letter are not significantly<br />
different according to t-test (P>0.05); N.I. - not identified; Unidentified<br />
peaks, #1, 3 and 5 are expressed as cyanidin-3-O-glucoside equivalents;<br />
Peaks #2 and 4 contents are expressed according to <strong>the</strong>ir own standard curves<br />
The ratios <strong>of</strong> <strong>the</strong> combined relative peak areas <strong>of</strong> <strong>the</strong> characteristic peaks (#; 1, 2, 3, 4<br />
and 5) to <strong>the</strong> total peaks area were 0.31 ± 0.02 in green leaves and 0.21 ± 0.01 in red<br />
leaves (Appendix, Table 2).