Staff Report - City of Alexandria
Staff Report - City of Alexandria
Staff Report - City of Alexandria

You also want an ePaper? Increase the reach of your titles
YUMPU automatically turns print PDFs into web optimized ePapers that Google loves.
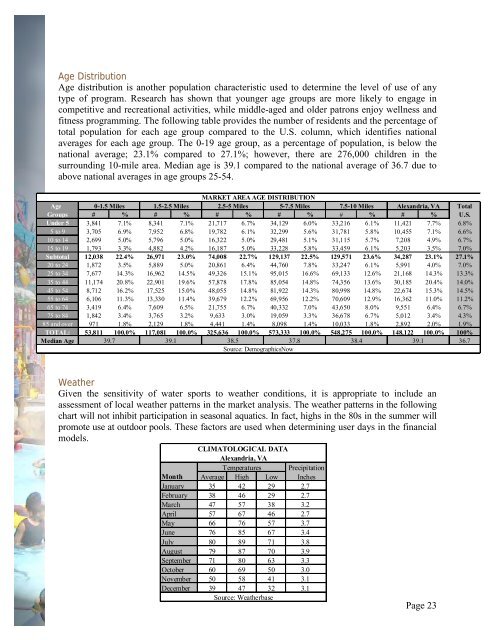
Age Distribution<br />
Age distribution is another population characteristic used to determine the level <strong>of</strong> use <strong>of</strong> any<br />
type <strong>of</strong> program. Research has shown that younger age groups are more likely to engage in<br />
competitive and recreational activities, while middle-aged and older patrons enjoy wellness and<br />
fitness programming. The following table provides the number <strong>of</strong> residents and the percentage <strong>of</strong><br />
total population for each age group compared to the U.S. column, which identifies national<br />
averages for each age group. The 0-19 age group, as a percentage <strong>of</strong> population, is below the<br />
national average; 23.1% compared to 27.1%; however, there are 276,000 children in the<br />
surrounding 10-mile area. Median age is 39.1 compared to the national average <strong>of</strong> 36.7 due to<br />
above national averages in age groups 25-54.<br />
MARKET AREA AGE DISTRIBUTION<br />
Age 0-1.5 Miles 1.5-2.5 Miles 2.5-5 Miles 5-7.5 Miles 7.5-10 Miles <strong>Alexandria</strong>, VA Total<br />
Groups # % # % # % # % # % # % U.S.<br />
Under 5 3,841 7.1% 8,341 7.1% 21,717 6.7% 34,129 6.0% 33,216 6.1% 11,421 7.7% 6.8%<br />
5 to 9 3,705 6.9% 7,952 6.8% 19,782 6.1% 32,299 5.6% 31,781 5.8% 10,455 7.1% 6.6%<br />
10 to 14 2,699 5.0% 5,796 5.0% 16,322 5.0% 29,481 5.1% 31,115 5.7% 7,208 4.9% 6.7%<br />
15 to 19 1,793 3.3% 4,882 4.2% 16,187 5.0% 33,228 5.8% 33,459 6.1% 5,203 3.5% 7.0%<br />
Subtotal 12,038 22.4% 26,971 23.0% 74,008 22.7% 129,137 22.5% 129,571 23.6% 34,287 23.1% 27.1%<br />
20 to 24 1,872 3.5% 5,889 5.0% 20,861 6.4% 44,760 7.8% 33,247 6.1% 5,991 4.0% 7.0%<br />
25 to 34 7,677 14.3% 16,962 14.5% 49,326 15.1% 95,015 16.6% 69,133 12.6% 21,168 14.3% 13.3%<br />
35 to 44 11,174 20.8% 22,901 19.6% 57,878 17.8% 85,054 14.8% 74,356 13.6% 30,185 20.4% 14.0%<br />
45 to 54 8,712 16.2% 17,525 15.0% 48,055 14.8% 81,922 14.3% 80,998 14.8% 22,674 15.3% 14.5%<br />
55 to 64 6,106 11.3% 13,330 11.4% 39,679 12.2% 69,956 12.2% 70,609 12.9% 16,362 11.0% 11.2%<br />
65 to 74 3,419 6.4% 7,609 6.5% 21,755 6.7% 40,332 7.0% 43,650 8.0% 9,551 6.4% 6.7%<br />
75 to 84 1,842 3.4% 3,765 3.2% 9,633 3.0% 19,059 3.3% 36,678 6.7% 5,012 3.4% 4.3%<br />
85 and over 971 1.8% 2,129 1.8% 4,441 1.4% 8,098 1.4% 10,033 1.8% 2,892 2.0% 1.9%<br />
TOTAL: 53,811 100.0% 117,081 100.0% 325,636 100.0% 573,333 100.0% 548,275 100.0% 148,122 100.0% 100%<br />
Median Age 39.7 39.1 38.5 37.8<br />
38.4 39.1<br />
36.7<br />
Source: DemographicsNow<br />
Weather<br />
Given the sensitivity <strong>of</strong> water sports to weather conditions, it is appropriate to include an<br />
assessment <strong>of</strong> local weather patterns in the market analysis. The weather patterns in the following<br />
chart will not inhibit participation in seasonal aquatics. In fact, highs in the 80s in the summer will<br />
promote use at outdoor pools. These factors are used when determining user days in the financial<br />
models.<br />
CLIMATOLOGICAL DATA<br />
<strong>Alexandria</strong>, VA<br />
Temperatures Precipitation<br />
Month Average High Low Inches<br />
January 35 42 29 2.7<br />
February 38 46 29 2.7<br />
March 47 57 38 3.2<br />
April 57 67 46 2.7<br />
May 66 76 57 3.7<br />
June 76 85 67 3.4<br />
July 80 89 71 3.8<br />
August 79 87 70 3.9<br />
September 71 80 63 3.3<br />
October 60 69 50 3.0<br />
November 50 58 41 3.1<br />
December 39 47 32 3.1<br />
Source: Weatherbase<br />
Page 23