MAGNETISM ELECTRON TRANSPORT MAGNETORESISTIVE LANTHANUM CALCIUM MANGANITE
MAGNETISM ELECTRON TRANSPORT MAGNETORESISTIVE LANTHANUM CALCIUM MANGANITE
MAGNETISM ELECTRON TRANSPORT MAGNETORESISTIVE LANTHANUM CALCIUM MANGANITE
You also want an ePaper? Increase the reach of your titles
YUMPU automatically turns print PDFs into web optimized ePapers that Google loves.
xvi<br />
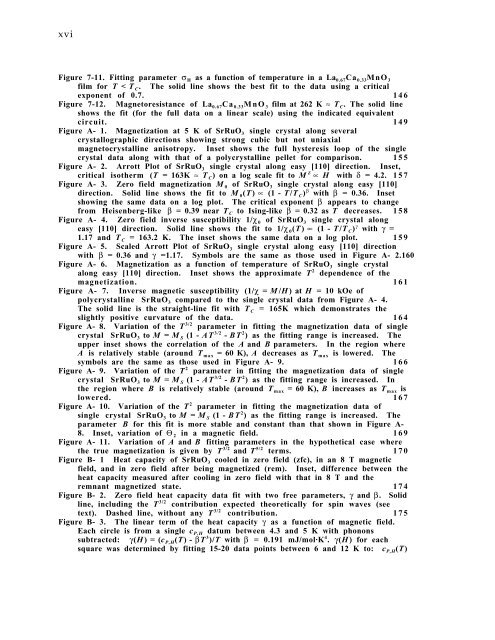
Figure 7-11. Fitting parameter σ H as a function of temperature in a La 0.67Ca 0.33MnO 3<br />
film for T < T C. The solid line shows the best fit to the data using a critical<br />
exponent of 0.7. 146<br />
Figure 7-12. Magnetoresistance of La 0.67Ca 0.33MnO 3 film at 262 K ≈ T C. The solid line<br />
shows the fit (for the full data on a linear scale) using the indicated equivalent<br />
circuit. 149<br />
Figure A- 1. Magnetization at 5 K of SrRuO 3 single crystal along several<br />
crystallographic directions showing strong cubic but not uniaxial<br />
magnetocrystalline anisotropy. Inset shows the full hysteresis loop of the single<br />
crystal data along with that of a polycrystalline pellet for comparison. 155<br />
Figure A- 2. Arrott Plot of SrRuO 3 single crystal along easy [110] direction. Inset,<br />
critical isotherm (T = 163K ≈ T C) on a log scale fit to M δ ∝ H with δ = 4.2. 1 5 7<br />
Figure A- 3. Zero field magnetization M 0 of SrRuO 3 single crystal along easy [110]<br />
direction. Solid line shows the fit to M 0(T ) ∝ (1 - T /T C) β with β = 0.36. Inset<br />
showing the same data on a log plot. The critical exponent β appears to change<br />
from Heisenberg-like β = 0.39 near T C to Ising-like β = 0.32 as T decreases. 158<br />
Figure A- 4. Zero field inverse susceptibility 1/χ 0 of SrRuO 3 single crystal along<br />
easy [110] direction. Solid line shows the fit to 1/χ 0(T ) ∝ (1 - T /T C) γ with γ =<br />
1.17 and T C = 163.2 K. The inset shows the same data on a log plot. 159<br />
Figure A- 5. Scaled Arrott Plot of SrRuO 3 single crystal along easy [110] direction<br />
with β = 0.36 and γ =1.17. Symbols are the same as those used in Figure A- 2.160<br />
Figure A- 6. Magnetization as a function of temperature of SrRuO 3 single crystal<br />
along easy [110] direction. Inset shows the approximate T 2 dependence of the<br />
magnetization. 161<br />
Figure A- 7. Inverse magnetic susceptibility (1/χ = M /H ) at H = 10 kOe of<br />
polycrystalline SrRuO 3 compared to the single crystal data from Figure A- 4.<br />
The solid line is the straight-line fit with T C = 165K which demonstrates the<br />
slightly positive curvature of the data. 164<br />
Figure A- 8. Variation of the T 3/2 parameter in fitting the magnetization data of single<br />
crystal SrRuO 3 to M = M S (1 - AT 3/2 - BT 2 ) as the fitting range is increased. The<br />
upper inset shows the correlation of the A and B parameters. In the region where<br />
A is relatively stable (around T max = 60 K), A decreases as T max is lowered. The<br />
symbols are the same as those used in Figure A- 9. 166<br />
Figure A- 9. Variation of the T 2 parameter in fitting the magnetization data of single<br />
crystal SrRuO 3 to M = M S (1 - AT 3/2 - BT 2 ) as the fitting range is increased. In<br />
the region where B is relatively stable (around T max = 60 K), B increases as T max is<br />
lowered. 167<br />
Figure A- 10. Variation of the T 2 parameter in fitting the magnetization data of<br />
single crystal SrRuO 3 to M = M S (1 - BT 2 ) as the fitting range is increased. The<br />
parameter B for this fit is more stable and constant than that shown in Figure A-<br />
8. Inset, variation of Θ 2 in a magnetic field. 169<br />
Figure A- 11. Variation of A and B fitting parameters in the hypothetical case where<br />
the true magnetization is given by T 3/2 and T 5/2 terms. 170<br />
Figure B- 1 Heat capacity of SrRuO 3 cooled in zero field (zfc), in an 8 T magnetic<br />
field, and in zero field after being magnetized (rem). Inset, difference between the<br />
heat capacity measured after cooling in zero field with that in 8 T and the<br />
remnant magnetized state. 174<br />
Figure B- 2. Zero field heat capacity data fit with two free parameters, γ and β. Solid<br />
line, including the T 3/2 contribution expected theoretically for spin waves (see<br />
text). Dashed line, without any T 3/2 contribution. 175<br />
Figure B- 3. The linear term of the heat capacity γ as a function of magnetic field.<br />
Each circle is from a single c P,H datum between 4.3 and 5 K with phonons<br />
subtracted: γ(H ) = (c P,H(T) - βT 3 )/T with β = 0.191 mJ/mol·K 4 . γ(H ) for each<br />
square was determined by fitting 15-20 data points between 6 and 12 K to: c P,H(T)


