PDF - 3756 kB - CARNet
PDF - 3756 kB - CARNet
PDF - 3756 kB - CARNet

Create successful ePaper yourself
Turn your PDF publications into a flip-book with our unique Google optimized e-Paper software.
S. KUT: A SIMPLE METHOD TO DETERMINE DUCTILE FRACTURE STRAIN IN A TENSILE TEST OF PLANE SPECIMEN’S<br />
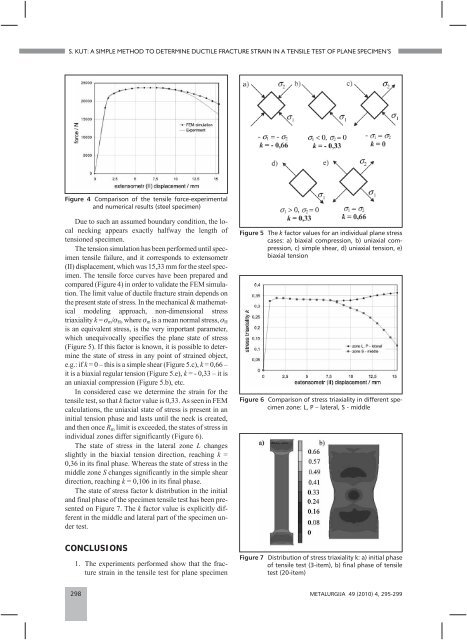
Figure 4 Comparison of the tensile force-experimental<br />
and numerical results (steel specimen)<br />
Due to such an assumed boundary condition, the local<br />
necking appears exactly halfway the length of<br />
tensioned specimen.<br />
The tension simulation has been performed until specimen<br />
tensile failure, and it corresponds to extensometr<br />
(II) displacement, which was 15,33 mm for the steel specimen.<br />
The tensile force curves have been prepared and<br />
compared (Figure 4) in order to validate the FEM simulation.<br />
The limit value of ductile fracture strain depends on<br />
the present state of stress. In the mechanical & mathematical<br />
modeling approach, non-dimensional stress<br />
triaxiality k = m/H, where m is a mean normal stress, H<br />
is an equivalent stress, is the very important parameter,<br />
which unequivocally specifies the plane state of stress<br />
(Figure 5). If this factor is known, it is possible to determine<br />
the state of stress in any point of strained object,<br />
e.g.: if k = 0 – this is a simple shear (Figure 5.c), k = 0,66 –<br />
it is a biaxial regular tension (Figure 5.e), k =-0,33–itis<br />
an uniaxial compression (Figure 5.b), etc.<br />
In considered case we determine the strain for the<br />
tensile test, so that k factor value is 0,33. As seen in FEM<br />
calculations, the uniaxial state of stress is present in an<br />
initial tension phase and lasts until the neck is created,<br />
and then once Rm limit is exceeded, the states of stress in<br />
individual zones differ significantly (Figure 6).<br />
The state of stress in the lateral zone L changes<br />
slightly in the biaxial tension direction, reaching k =<br />
0,36 in its final phase. Whereas the state of stress in the<br />
middle zone S changes significantly in the simple shear<br />
direction, reaching k = 0,106 in its final phase.<br />
The state of stress factor k distribution in the initial<br />
and final phase of the specimen tensile test has been presented<br />
on Figure 7. The k factor value is explicitly different<br />
in the middle and lateral part of the specimen under<br />
test.<br />
CONCLUSIONS<br />
1. The experiments performed show that the fracture<br />
strain in the tensile test for plane specimen<br />
Figure 5 The k factor values for an individual plane stress<br />
cases: a) biaxial compression, b) uniaxial compression,<br />
c) simple shear, d) uniaxial tension, e)<br />
biaxial tension<br />
Figure 6 Comparison of stress triaxiality in different specimen<br />
zone: L, P – lateral, S - middle<br />
Figure 7 Distribution of stress triaxiality k: a) initial phase<br />
of tensile test (3-item), b) final phase of tensile<br />
test (20-item)<br />
298 METALURGIJA 49 (2010) 4, 295-299