PDF - 3756 kB - CARNet
PDF - 3756 kB - CARNet
PDF - 3756 kB - CARNet

You also want an ePaper? Increase the reach of your titles
YUMPU automatically turns print PDFs into web optimized ePapers that Google loves.
S. KASTELIC et al.: PREDICTION OF NUMERICAL DISTORTION AFTER WELDING WITH VARIOUS WELDING...<br />
Figure 7 CCT diagram of St355 steel<br />
very important parameters are also stresses and<br />
microstructure in the welding area after the welding.<br />
Deformation of test cover after the welding with the<br />
second sequence in the flange area was less than 2 mm.<br />
The deformed shape of the cover is presented in Figure<br />
8. In this picture wireframe of cover before welding and<br />
also the deformed shape afterwards are presented. The<br />
deformed shape was multiplied by 20 so that deformed<br />
shape is more pronounced.<br />
Effect of various welding sequences and clamping<br />
conditions is presented in Figures 9a and 9b. Maximum<br />
deformation after welding with the first sequence was<br />
4,3 mm. Deformation of test cover on the X-axis after<br />
welding is shown in Figure 9a.<br />
Welding with the second sequence resulted in<br />
smaller deformation. The deformation on the X-axis,<br />
shown in Figure 9b, is smaller and it is less than 2 mm.<br />
The deformed shape in Figures 8 and 9 is multiplied by<br />
20.<br />
Figure 10 Stresses after welding with first sequence (a), and second sequence (b)<br />
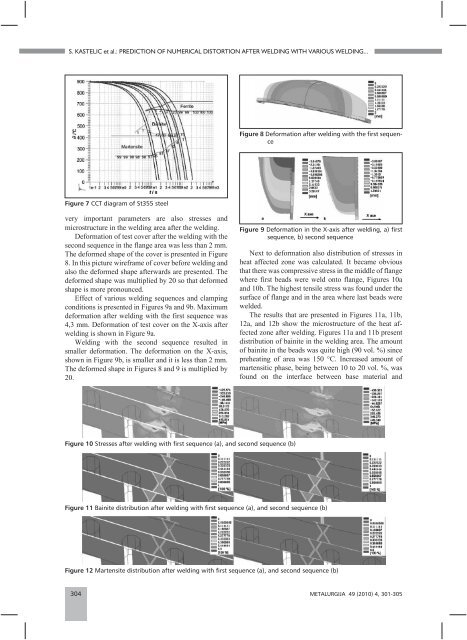
Figure 8 Deformation after welding with the first sequence<br />
Figure 9 Deformation in the X-axis after welding, a) first<br />
sequence, b) second sequence<br />
Next to deformation also distribution of stresses in<br />
heat affected zone was calculated. It became obvious<br />
that there was compressive stress in the middle of flange<br />
where first beads were weld onto flange, Figures 10a<br />
and 10b. The highest tensile stress was found under the<br />
surface of flange and in the area where last beads were<br />
welded.<br />
The results that are presented in Figures 11a, 11b,<br />
12a, and 12b show the microstructure of the heat affected<br />
zone after welding. Figures 11a and 11b present<br />
distribution of bainite in the welding area. The amount<br />
of bainite in the beads was quite high (90 vol. %) since<br />
preheating of area was 150 °C. Increased amount of<br />
martensitic phase, being between 10 to 20 vol. %, was<br />
found on the interface between base material and<br />
Figure 11 Bainite distribution after welding with first sequence (a), and second sequence (b)<br />
Figure 12 Martensite distribution after welding with first sequence (a), and second sequence (b)<br />
304 METALURGIJA 49 (2010) 4, 301-305