PDF - 3756 kB - CARNet
PDF - 3756 kB - CARNet
PDF - 3756 kB - CARNet

You also want an ePaper? Increase the reach of your titles
YUMPU automatically turns print PDFs into web optimized ePapers that Google loves.
S. KASTELIC et al.: PREDICTION OF NUMERICAL DISTORTION AFTER WELDING WITH VARIOUS WELDING...<br />
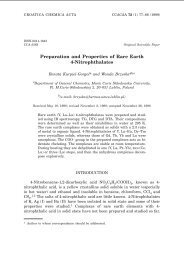
Figure 4 Temperature distribution after welding the last<br />
bead on flange<br />
Table 2 Chemical composition of St355 steel<br />
Heat input on the cover was defined for each bead<br />
with ten macro steps. It meant that weld on the cover<br />
was divided into ten segments.<br />
Heat was then defined for each segment separately<br />
with time delay between single segments. Time delay<br />
between segments depended on the length of segment<br />
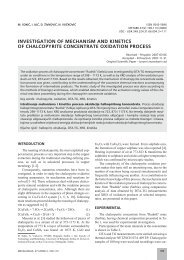
and on the welding speed. Temperature distribution<br />
during welding the first bead onto the cover is shown in<br />
Figure 5.<br />
DEFININING MECHANICAL PROPERTIES<br />
Base material of the cover is St355 steel with chemical<br />
composition presented in Table 2. In order to obtain<br />
reliable numerical results, precise thermal and material<br />
properties of the used material must be taken in account.<br />
Figure 5 Temperature distribution during the first bead on<br />
cover<br />
Element C Si Mn P S Al N Cr Cu Ni<br />
Composition in wt% 0,18 0,47 1,24 0,029 0,029 0,024 0,0085 0,10 0,17 0,06<br />
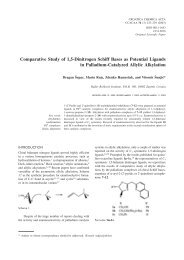
Figure 6a Density Figure 6b Thermal conductivity Figure 6c Young’s modulus<br />
Figure 6d Latent heat Figure 6e Yield stress Figure 6f Strain hardening<br />
All these properties must be measured as functions of<br />
temperature and phases. Yield stress, thermal strains,<br />
Young’s modulus, Poisson ratio, strain hardening, density,<br />
thermal conductivity and latent heat must be known<br />
for quality welding. Some of these properties are presented<br />
in graphs in Figures 6a to 6f.<br />
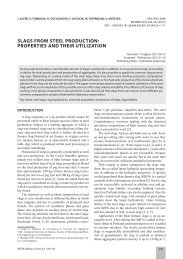
Digitalized CCT diagram is needed for calculation of<br />
microstructural constituents. Diagram is presented in<br />
Figure 7.<br />
RESULTS<br />
With all these data several results for deformation after<br />
welding can be obtained. In our case, deformation after<br />
welding was the main goal. Next to deformation,<br />
METALURGIJA 49 (2010) 4, 301-305 303