

October - Library - Central Queensland University
October - Library - Central Queensland University
October - Library - Central Queensland University

You also want an ePaper? Increase the reach of your titles
YUMPU automatically turns print PDFs into web optimized ePapers that Google loves.
20<br />
Backlog<br />
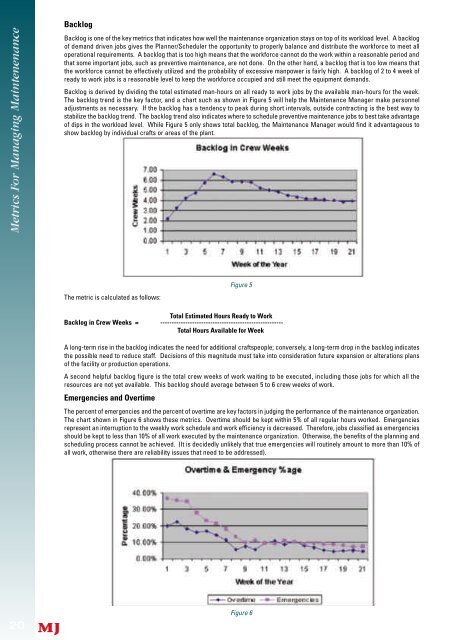
Backlog is one of the key metrics that indicates how well the maintenance organization stays on top of its workload level. A backlog<br />
of demand driven jobs gives the Planner/Scheduler the opportunity to properly balance and distribute the workforce to meet all<br />
operational requirements. A backlog that is too high means that the workforce cannot do the work within a reasonable period and<br />
that some important jobs, such as preventive maintenance, are not done. On the other hand, a backlog that is too low means that<br />
the workforce cannot be effectively utilized and the probability of excessive manpower is fairly high. A backlog of 2 to 4 week of<br />
ready to work jobs is a reasonable level to keep the workforce occupied and still meet the equipment demands.<br />
Backlog is derived by dividing the total estimated man-hours on all ready to work jobs by the available man-hours for the week.<br />
The backlog trend is the key factor, and a chart such as shown in Figure 5 will help the Maintenance Manager make personnel<br />
adjustments as necessary. If the backlog has a tendency to peak during short intervals, outside contracting is the best way to<br />
stabilize the backlog trend. The backlog trend also indicates where to schedule preventive maintenance jobs to best take advantage<br />
of dips in the workload level. While Figure 5 only shows total backlog, the Maintenance Manager would find it advantageous to<br />
show backlog by individual crafts or areas of the plant.<br />
The metric is calculated as follows:<br />
Figure 5<br />
Total Estimated Hours Ready to Work<br />
Backlog in Crew Weeks = ------------------------------------------------------<br />
Total Hours Available for Week<br />
A long-term rise in the backlog indicates the need for additional craftspeople; conversely, a long-term drop in the backlog indicates<br />
the possible need to reduce staff. Decisions of this magnitude must take into consideration future expansion or alterations plans<br />
of the facility or production operations.<br />
A second helpful backlog figure is the total crew weeks of work waiting to be executed, including those jobs for which all the<br />
resources are not yet available. This backlog should average between 5 to 6 crew weeks of work.<br />
Emergencies and Overtime<br />
The percent of emergencies and the percent of overtime are key factors in judging the perf o rmance of the maintenance org a n i z a t i o n .<br />
The chart shown in Figure 6 shows these metrics. Overtime should be kept within 5% of all regular hours worked. Emergencies<br />
re p resent an interruption to the weekly work schedule and work efficiency is decreased. There f o re, jobs classified as emerg e n c i e s<br />
should be kept to less than 10% of all work executed by the maintenance organization. Otherwise, the benefits of the planning and<br />
scheduling process cannot be achieved. (It is decidedly unlikely that true emergencies will routinely amount to more than 10% of<br />
all work, otherwise there are reliability issues that need to be addressed).<br />
Figure 6


