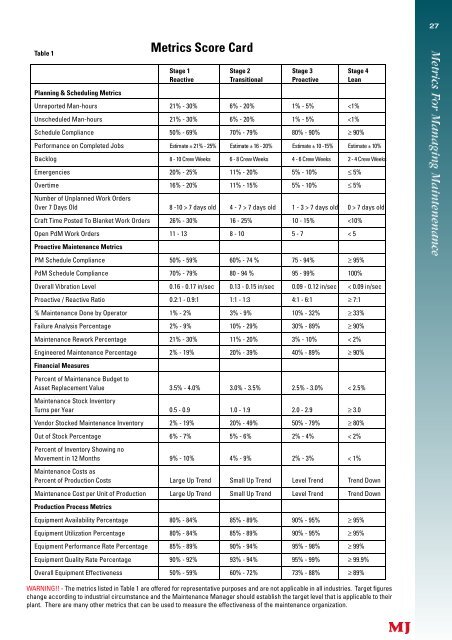
26 Performance Rate Percentage P e rf o rmance Rate is an expression of the actual production rate as a percentage of the plant’s design capacity (speed). The actual production rate is expressed as an average and is calculated by dividing the actual production by the operating time. Both design capacity and actual production rate are expressed in units produced (U) per unit time (t). The metric is calculated as follows: Average Actual Production Rate (U/t) Performance Rate % = ---------------------------------------------- X 100% Design Capacity (U/t) Where: Actual Production (U) Average Actual Production Rate = ---------------------------- Operating Time (t ) Quality Rate Percentage The Quality Rate percentage expresses the amount of acceptable product as a percentage of total products produced. Some industries refer to this at the "first pass yield" or "first right intent", and it refers to the amount of product that can be shipped without further processing. The metric is calculated as follows: Total Units Produced - (Units Downgraded + Units Scraped + Units Reprocessed) Quality Rate % = ------------------------------------------------------------------------------------------------ X 100% Total Production Units Overall Equipment Effectiveness The Overall Equipment Effectiveness (OEE) is the product of Availability percentage, Utilization percentage, Perf o rmance Rate p e rcentage, and the Quality Rate percentage. The resulting value is the percentage rate at which the plant’s potential is being utilized. It is a comprehensive indicator of the plant’s condition that takes into account operating time, operating utilization, operating speed, and product quality. In effect, OEE measures the effectiveness with which the plant is being used to add value to the company. The metric is calculated as follows: OEE = Availability % X Utilization % X Performance Rate % X Quality Rate % Metrics Score Card Every maintenance organization is in one of four stages of development (see Table 1). The stage of the maintenance organization is determined by were it ranks in the maintenance metrics as summarized in Table 1. Circle the answers that best match the company’s status on the metric listed. These are just a few of the yardsticks Day & Zimmermann has found useful in appraising the maintenance operation. Each Maintenance Manger could come up with many more metrics that are appropriate to the local situation. The most import a n t requirement is that the basic information is accurate and reliable. Cost reporting through the use of a well functioning computerized maintenance management system supplies the information that is re q u i red to make these comparisons. Maintenance must make every eff o rt to charge costs as accurately and finitely as possible. If Maintenance is to be a dynamic force in the plant organization it must be able to show improvement. Improvement is accomplished t h rough control and control is exercised as the result of measurement. If you can measure maintenance you can impro v e maintenance. Strive to improve maintenance using the managerial technique of performance metrics. References: Peter C Chalich, “Stage Metric Data Gathering Guidelines”, Day & Zimmermann International Inc., September 2002. Raymond P. McFarland, “Managing Maintenance With Planning and Scheduling”, Management Handbook for Plant Engineers, Bernard T. Lewis, Editor, McGraw-Hill Book Company 1977. Raymond P. McFarland, “Maintenance Cost Analysis for Performance Improvement”, AIPE Plant Engineering and Western Maintenance Conference, San Francisco, November 1970. Raymond P. McFarland, “Cost Accounting and Budgeting for Maintenance”, National Plant Engineering and Maintenance Conference, Chicago, IL, April 1970. Raymond P. McFarland, “Maintenance Cost Analysis for Cost Reduction”, National Plant Engineering and Maintenance Conference, Cleveland, OH, March 1971. The Author: Ray Mcfarland is a Principal Adviser with the global mining giant Rio Tinto. The concepts presented in this paper were developed while working for Day and Zimmermann International, Inc.
Table 1 Planning & Scheduling Metrics Stage 1 Stage 2 Stage 3 Stage 4 Reactive Transitional Proactive Lean Unreported Man-hours 21% - 30% 6% - 20% 1% - 5% 7 days old 1 - 3 > 7 days old 0 > 7 days old Craft Time Posted To Blanket Work Orders 26% - 30% 16 - 25% 10 - 15%