October - Library - Central Queensland University
October - Library - Central Queensland University
October - Library - Central Queensland University
Create successful ePaper yourself
Turn your PDF publications into a flip-book with our unique Google optimized e-Paper software.
22<br />
Proactive Maintenance Metrics<br />
PM and PdM Schedule Compliance<br />
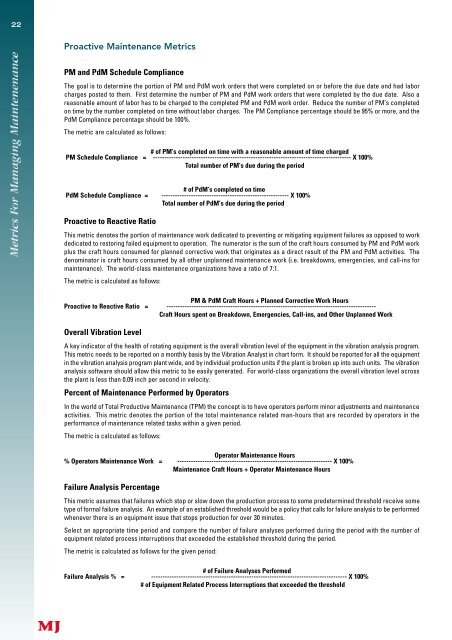
The goal is to determine the portion of PM and PdM work orders that were completed on or before the due date and had labor<br />
c h a rges posted to them. First determine the number of PM and PdM work orders that were completed by the due date. Also a<br />
reasonable amount of labor has to be charged to the completed PM and PdM work order. Reduce the number of PM’s completed<br />
on time by the number completed on time without labor charges. The PM Compliance percentage should be 95% or more, and the<br />
PdM Compliance percentage should be 100%.<br />
The metric are calculated as follows:<br />
# of PM’s completed on time with a reasonable amount of time charged<br />
PM Schedule Compliance = --------------------------------------------------------------------------------------- X 100%<br />
Total number of PM’s due during the period<br />
# of PdM’s completed on time<br />
PdM Schedule Compliance = -------------------------------------------------------- X 100%<br />
Total number of PdM’s due during the period<br />
Proactive to Reactive Ratio<br />
This metric denotes the portion of maintenance work dedicated to preventing or mitigating equipment failures as opposed to work<br />
dedicated to restoring failed equipment to operation. The numerator is the sum of the craft hours consumed by PM and PdM work<br />
plus the craft hours consumed for planned corrective work that originates as a direct result of the PM and PdM activities. The<br />
denominator is craft hours consumed by all other unplanned maintenance work (i.e. breakdowns, emergencies, and call-ins for<br />
maintenance). The world-class maintenance organizations have a ratio of 7:1.<br />
The metric is calculated as follows:<br />
PM & PdM Craft Hours + Planned Corrective Work Hours<br />
Proactive to Reactive Ratio = --------------------------------------------------------------------------------------------<br />
Craft Hours spent on Breakdown, Emergencies, Call-ins, and Other Unplanned Work<br />
Overall Vibration Level<br />
A key indicator of the health of rotating equipment is the overall vibration level of the equipment in the vibration analysis program.<br />
This metric needs to be re p o rted on a monthly basis by the Vibration Analyst in chart form. It should be re p o rted for all the equipment<br />
in the vibration analysis program plant wide, and by individual production units if the plant is broken up into such units. The vibration<br />
analysis software should allow this metric to be easily generated. For world-class organizations the overall vibration level across<br />
the plant is less than 0.09 inch per second in velocity.<br />
Percent of Maintenance Performed by Operators<br />
In the world of Total Productive Maintenance (TPM) the concept is to have operators perform minor adjustments and maintenance<br />
activities. This metric denotes the portion of the total maintenance related man-hours that are re c o rded by operators in the<br />
performance of maintenance related tasks within a given period.<br />
The metric is calculated as follows:<br />
Operator Maintenance Hours<br />
% Operators Maintenance Work = -------------------------------------------------------------------- X 100%<br />
Maintenance Craft Hours + Operator Maintenance Hours<br />
Failure Analysis Percentage<br />
This metric assumes that failures which stop or slow down the production process to some predetermined threshold receive some<br />
type of formal failure analysis. An example of an established threshold would be a policy that calls for failure analysis to be perf o rm e d<br />
whenever there is an equipment issue that stops production for over 30 minutes.<br />
Select an appropriate time period and compare the number of failure analyses perf o rmed during the period with the number of<br />
equipment related process interruptions that exceeded the established threshold during the period.<br />
The metric is calculated as follows for the given period:<br />
# of Failure Analyses Performed<br />
Failure Analysis % = -------------------------------------------------------------------------------------- X 100%<br />
# of Equipment Related Process Interruptions that exceeded the threshold


