

October - Library - Central Queensland University
October - Library - Central Queensland University
October - Library - Central Queensland University

Create successful ePaper yourself
Turn your PDF publications into a flip-book with our unique Google optimized e-Paper software.
52<br />
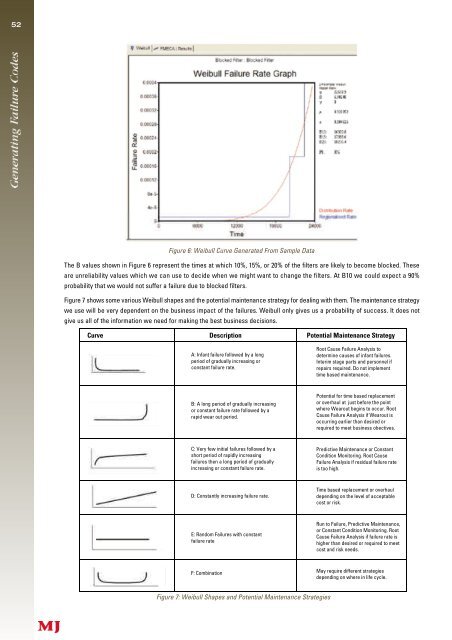
Figure 6: Weibull Curve Generated From Sample Data<br />
The B values shown in Figure 6 represent the times at which 10%, 15%, or 20% of the filters are likely to become blocked. These<br />
a re unreliability values which we can use to decide when we might want to change the filters. At B10 we could expect a 90%<br />
probability that we would not suffer a failure due to blocked filters.<br />
F i g u re 7 shows some various Weibull shapes and the potential maintenance strategy for dealing with them. The maintenance strategy<br />
we use will be very dependent on the business impact of the failures. Weibull only gives us a probability of success. It does not<br />
give us all of the information we need for making the best business decisions.<br />
Curve Description Potential Maintenance Strategy<br />
A: Infant failure followed by a long<br />
period of gradually increasing or<br />
constant failure rate.<br />
B: A long period of gradually increasing<br />
or constant failure rate followed by a<br />
rapid wear out period.<br />
C: Very few initial failures followed by a<br />
short period of rapidly increasing<br />
failures then a long period of gradually<br />
increasing or constant failure rate.<br />
D: Constantly increasing failure rate.<br />
E: Random Failures with constant<br />
failure rate<br />
F: Combination<br />
Figure 7: Weibull Shapes and Potential Maintenance Strategies<br />
Root Cause Failure Analysis to<br />
determine causes of infant failures.<br />
Interim stage parts and personnel if<br />
repairs required. Do not implement<br />
time based maintenance.<br />
Potential for time based replacement<br />
or overhaul at just before the point<br />
where Wearout begins to occur. Root<br />
Cause Failure Analysis if Wearout is<br />
occurring earlier than desired or<br />
required to meet business obectives.<br />
Predictive Maintenance or Constant<br />
Condition Monitoring. Root Cause<br />
Failure Analysis if residual failure rate<br />
is too high.<br />
Time based replacement or overhaul<br />
depending on the level of acceptable<br />
cost or risk.<br />
Run to Failure, Predictive Maintenance,<br />
or Constant Condition Monitoring. Root<br />
Cause Failure Analysis if failure rate is<br />
higher than desired or required to meet<br />
cost and risk needs.<br />
May require different strategies<br />
depending on where in life cycle.


