

October - Library - Central Queensland University
October - Library - Central Queensland University
October - Library - Central Queensland University

Create successful ePaper yourself
Turn your PDF publications into a flip-book with our unique Google optimized e-Paper software.
56<br />
Managerial Performance Financial Performance<br />
• Strategic Direction; • Return on Assets (ROA);<br />
• Management Team; • Return on Equity (ROE);<br />
• Leadership; • Capital Provision;<br />
• Succession Planning; • Stock Price Performance;<br />
• Employee Relations; • Book Value Performance;<br />
• Innovation; • Dividend Payout;<br />
• Board Relations; • Market Share.<br />
• Investor Relations;<br />
• Community Relations;<br />
• Regulatory (statutory) Compliance;<br />
• Risk Management.<br />
It is argued that the managerial performance measures relate to risk, and are ultimately reflected in the financial performance of<br />
the business. Risk management is part of the social responsibility of organizations, but is ultimately measured by the viability and<br />
profitability of the business. Financial performance is a tangible outcome that reflects the true performance of business and one<br />
against which the contribution of maintenance can be easily measured. Primary measures of financial perf o rmance for asset<br />
intensive business are Return on Assets and Return on Equity. Calculations of these measures vary between sources. For the<br />
purposes of this paper, these measures are defined as follows:<br />
R e t u rn on Assets (ROA) - A ratio of the net income a business is able to earn with its total assets. ROA is calculated by dividing<br />
operating profit by total assets.<br />
Return on Equity (ROE) - A ratio of the net income a business is able to earn with its total shareholders' equity. ROE is calculated<br />
by dividing operating profit by shareholders equity.<br />
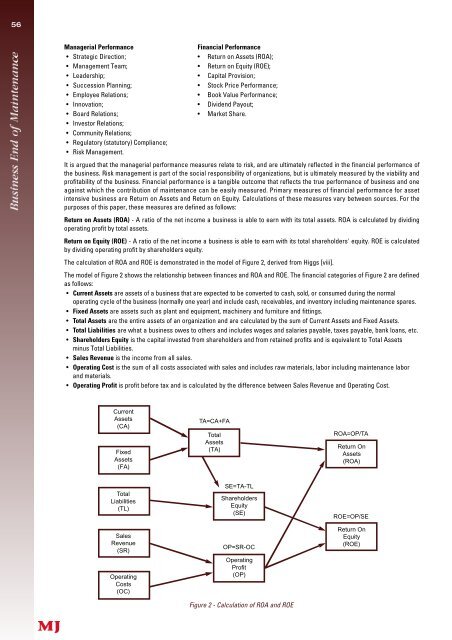
The calculation of ROA and ROE is demonstrated in the model of Figure 2, derived from Higgs [viii].<br />
The model of Figure 2 shows the relationship between finances and ROA and ROE. The financial categories of Figure 2 are defined<br />
as follows:<br />
• C u rrent Assets a re assets of a business that are expected to be converted to cash, sold, or consumed during the norm a l<br />
operating cycle of the business (normally one year) and include cash, receivables, and inventory including maintenance spares.<br />
• Fixed Assets are assets such as plant and equipment, machinery and furniture and fittings.<br />
• Total Assets are the entire assets of an organization and are calculated by the sum of Current Assets and Fixed Assets.<br />
• Total Liabilities are what a business owes to others and includes wages and salaries payable, taxes payable, bank loans, etc.<br />
• Shareholders Equity is the capital invested from shareholders and from retained profits and is equivalent to Total Assets<br />
minus Total Liabilities.<br />
• Sales Revenue is the income from all sales.<br />
• Operating Cost is the sum of all costs associated with sales and includes raw materials, labor including maintenance labor<br />
and materials.<br />
• Operating Profit is profit before tax and is calculated by the difference between Sales Revenue and Operating Cost.<br />
Current<br />
Assets<br />
(CA)<br />
Fixed<br />
Assets<br />
(FA)<br />
Total<br />
Liabilities<br />
(TL)<br />
Sales<br />
Revenue<br />
(SR)<br />
Operating<br />
Costs<br />
(OC)<br />
TA=CA+FA<br />
Total<br />
Assets<br />
(TA)<br />
SE=TA-TL<br />
Shareholders<br />
Equity<br />
(SE)<br />
OP=SR-OC<br />
Operating<br />
Profit<br />
(OP)<br />
Figure 2 - Calculation of ROA and ROE<br />
ROA=OP/TA<br />
Return On<br />
Assets<br />
(ROA)<br />
ROE=OP/SE<br />
Return On<br />
Equity<br />
(ROE)


