hydrogen production from water using solar cells powered nafion ...
hydrogen production from water using solar cells powered nafion ...
hydrogen production from water using solar cells powered nafion ...
Create successful ePaper yourself
Turn your PDF publications into a flip-book with our unique Google optimized e-Paper software.
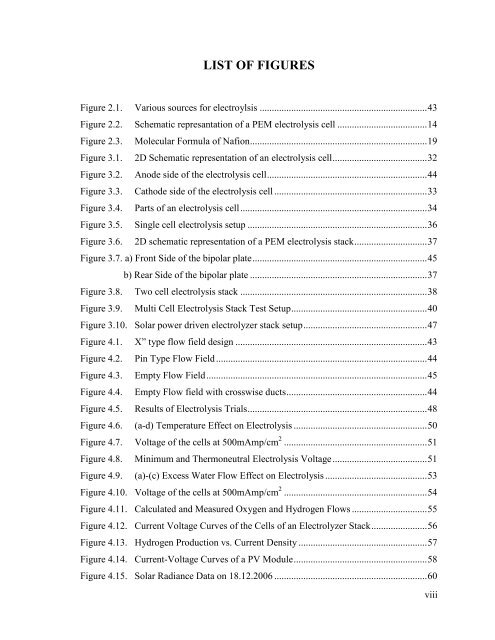
LIST OF FIGURES<br />
Figure 2.1. Various sources for electroylsis .....................................................................43<br />
Figure 2.2. Schematic represantation of a PEM electrolysis cell .....................................14<br />
Figure 2.3. Molecular Formula of Nafion.........................................................................19<br />
Figure 3.1. 2D Schematic representation of an electrolysis cell.......................................32<br />
Figure 3.2. Anode side of the electrolysis cell..................................................................44<br />
Figure 3.3. Cathode side of the electrolysis cell ...............................................................33<br />
Figure 3.4. Parts of an electrolysis cell.............................................................................34<br />
Figure 3.5. Single cell electrolysis setup ..........................................................................36<br />
Figure 3.6. 2D schematic representation of a PEM electrolysis stack..............................37<br />
Figure 3.7. a) Front Side of the bipolar plate........................................................................45<br />
b) Rear Side of the bipolar plate .........................................................................37<br />
Figure 3.8. Two cell electrolysis stack .............................................................................38<br />
Figure 3.9. Multi Cell Electrolysis Stack Test Setup........................................................40<br />
Figure 3.10. Solar power driven electrolyzer stack setup...................................................47<br />
Figure 4.1. X” type flow field design ...............................................................................43<br />
Figure 4.2. Pin Type Flow Field.......................................................................................44<br />
Figure 4.3. Empty Flow Field...........................................................................................45<br />
Figure 4.4. Empty Flow field with crosswise ducts..........................................................44<br />
Figure 4.5. Results of Electrolysis Trials..........................................................................48<br />
Figure 4.6. (a-d) Temperature Effect on Electrolysis .......................................................50<br />
Figure 4.7. Voltage of the <strong>cells</strong> at 500mAmp/cm 2 ...........................................................51<br />
Figure 4.8. Minimum and Thermoneutral Electrolysis Voltage.......................................51<br />
Figure 4.9. (a)-(c) Excess Water Flow Effect on Electrolysis ..........................................53<br />
Figure 4.10. Voltage of the <strong>cells</strong> at 500mAmp/cm 2 ...........................................................54<br />
Figure 4.11. Calculated and Measured Oxygen and Hydrogen Flows ...............................55<br />
Figure 4.12. Current Voltage Curves of the Cells of an Electrolyzer Stack.......................56<br />
Figure 4.13. Hydrogen Production vs. Current Density .....................................................57<br />
Figure 4.14. Current-Voltage Curves of a PV Module.......................................................58<br />
Figure 4.15. Solar Radiance Data on 18.12.2006 ...............................................................60<br />
viii


