Educational Assessment and Accountability; Annual Reports ...
Educational Assessment and Accountability; Annual Reports ...
Educational Assessment and Accountability; Annual Reports ...

Create successful ePaper yourself
Turn your PDF publications into a flip-book with our unique Google optimized e-Paper software.
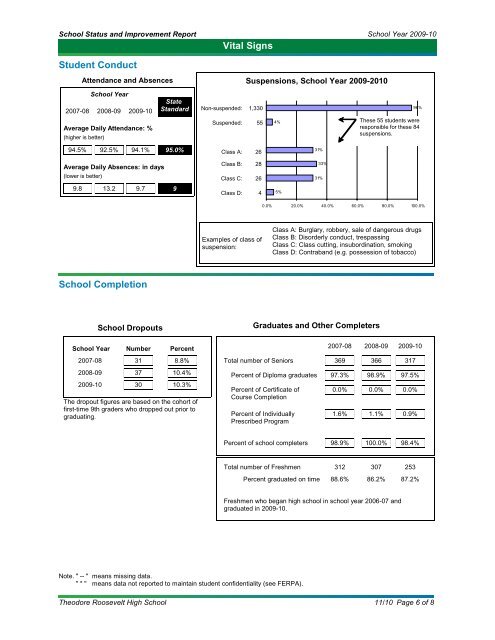
School Status <strong>and</strong> Improvement Report School Year 2009-10<br />
Student Conduct<br />
94.5%<br />
9.8<br />
Attendance <strong>and</strong> Absences<br />
School Year<br />
2007-08 2008-09 2009-10<br />
Average Daily Attendance: %<br />
(higher is better)<br />
92.5%<br />
13.2<br />
94.1%<br />
Average Daily Absences: in days<br />
(lower is better)<br />
9.7<br />
School Completion<br />
School Dropouts<br />
State<br />
St<strong>and</strong>ard<br />
95.0%<br />
School Year Number Percent<br />
2007-08<br />
31 8.8%<br />
2008-09<br />
37 10.4%<br />
2009-10<br />
30 10.3%<br />
The dropout figures are based on the cohort of<br />
first-time 9th graders who dropped out prior to<br />
graduating.<br />
9<br />
Vital Signs<br />
Non-suspended: 1,330<br />
Suspended: 55<br />
Class A: 26<br />
Class B: 28<br />
Class C: 26<br />
Class D: 4<br />
Examples of class of<br />
suspension:<br />
Total number of Seniors<br />
Percent of Diploma graduates<br />
Percent of Certificate of<br />
Course Completion<br />
Percent of Individually<br />
Prescribed Program<br />
Percent of school completers<br />
Note. " -- " means missing data.<br />
" * " means data not reported to maintain student confidentiality (see FERPA).<br />
Suspensions, School Year 2009-2010<br />
4%<br />
5%<br />
Class A: Burglary, robbery, sale of dangerous drugs<br />
Class B: Disorderly conduct, trespassing<br />
Class C: Class cutting, insubordination, smoking<br />
Class D: Contrab<strong>and</strong> (e.g. possession of tobacco)<br />
Graduates <strong>and</strong> Other Completers<br />
Total number of Freshmen<br />
Percent graduated on time<br />
2007-08 2008-09 2009-10<br />
369<br />
97.3%<br />
0.0%<br />
1.6%<br />
98.9%<br />
312<br />
88.6%<br />
366<br />
98.9%<br />
0.0%<br />
1.1%<br />
100.0%<br />
307<br />
86.2%<br />
Freshmen who began high school in school year 2006-07 <strong>and</strong><br />
graduated in 2009-10.<br />
31%<br />
33%<br />
31%<br />
317<br />
97.5%<br />
0.0%<br />
0.9%<br />
98.4%<br />
253<br />
96%<br />
These 55 students were<br />
responsible for these 84<br />
suspensions.<br />
0.0% 20.0% 40.0% 60.0% 80.0% 100.0%<br />
Theodore Roosevelt High School 11/10 Page 6 of 8<br />
87.2%