Educational Assessment and Accountability; Annual Reports ...
Educational Assessment and Accountability; Annual Reports ...
Educational Assessment and Accountability; Annual Reports ...

You also want an ePaper? Increase the reach of your titles
YUMPU automatically turns print PDFs into web optimized ePapers that Google loves.
12 2009 SuperintenDent’S <strong>Annual</strong> Report<br />
oUr CoMMITMenT to eDUCaTIon<br />
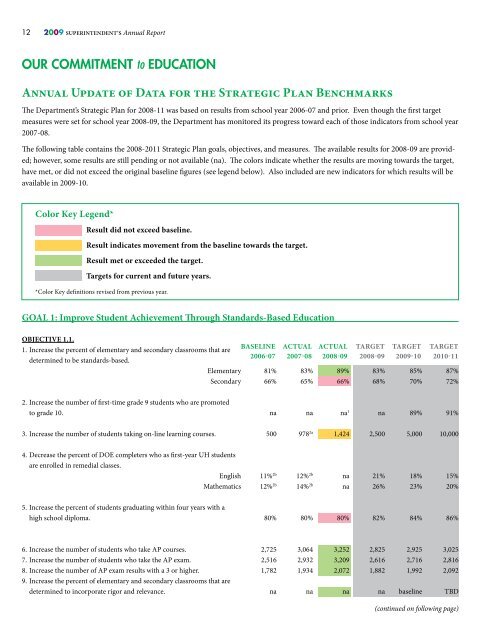
<strong>Annual</strong> Update of Data for the Strategic Plan Benchmarks<br />
The Department’s Strategic Plan for 2008-11 was based on results from school year 2006-07 <strong>and</strong> prior. Even though the first target<br />
measures were set for school year 2008-09, the Department has monitored its progress toward each of those indicators from school year<br />
2007-08.<br />
The following table contains the 2008-2011 Strategic Plan goals, objectives, <strong>and</strong> measures. The available results for 2008-09 are provided;<br />
however, some results are still pending or not available (na). The colors indicate whether the results are moving towards the target,<br />
have met, or did not exceed the original baseline figures (see legend below). Also included are new indicators for which results will be<br />
available in 2009-10.<br />
Color Key Legend*<br />
Result did not exceed baseline.<br />
Result indicates movement from the baseline towards the target.<br />
Result met or exceeded the target.<br />
Targets for current <strong>and</strong> future years.<br />
*Color Key definitions revised from previous year.<br />
GOAL 1: Improve Student Achievement Through St<strong>and</strong>ards-Based Education<br />
OBjECTIvE 1.1.<br />
1. Increase the percent of elementary <strong>and</strong> secondary classrooms that are<br />
determined to be st<strong>and</strong>ards-based.<br />
BASELINE ACTUAL ACTUAL TARGET TARGET TARGET<br />
2006-07 2007-08 2008-09 2008-09 2009-10 2010-11<br />
Elementary 81% 83% 89% 83% 85% 87%<br />
Secondary 66% 65% 66% 68% 70% 72%<br />
2. Increase the number of first-time grade 9 students who are promoted<br />
to grade 10. na na na 1 na 89% 91%<br />
3. Increase the number of students taking on-line learning courses. 500 978 2a 1,424 2,500 5,000 10,000<br />
4. Decrease the percent of DOE completers who as first-year UH students<br />
are enrolled in remedial classes.<br />
English 11% 2b 12% 2b na 21% 18% 15%<br />
Mathematics 12% 2b 14% 2b na 26% 23% 20%<br />
5. Increase the percent of students graduating within four years with a<br />
high school diploma. 80% 80% 80% 82% 84% 86%<br />
6. Increase the number of students who take AP courses. 2,725 3,064 3,252 2,825 2,925 3,025<br />
7. Increase the number of students who take the AP exam. 2,516 2,932 3,209 2,616 2,716 2,816<br />
8. Increase the number of AP exam results with a 3 or higher. 1,782 1,934 2,072 1,882 1,992 2,092<br />
9. Increase the percent of elementary <strong>and</strong> secondary classrooms that are<br />
determined to incorporate rigor <strong>and</strong> relevance. na na na na baseline TBD<br />
(continued on following page)