Educational Assessment and Accountability; Annual Reports ...
Educational Assessment and Accountability; Annual Reports ...
Educational Assessment and Accountability; Annual Reports ...

You also want an ePaper? Increase the reach of your titles
YUMPU automatically turns print PDFs into web optimized ePapers that Google loves.
6 2009 SuperintenDent’S <strong>Annual</strong> Report<br />
aT-a-GlanCe<br />
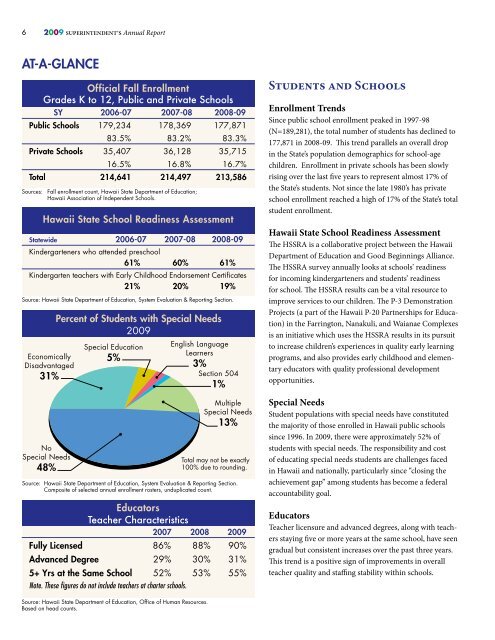
Official Fall Enrollment<br />
<br />
SY 2006-07 2007-08 2008-09<br />
Public Schools 179,234 178,369 177,871<br />
83.5% 83.2% 83.3%<br />
Private Schools 35,407 36,128 35,715<br />
16.5% 16.8% 16.7%<br />
Total 214,641 214,497 213,586<br />
Sources: Fall enrollment count, Hawaii State Department of Education;<br />
Hawaii Association of Independent Schools.<br />
Hawaii State School Readiness <strong>Assessment</strong><br />
Statewide 2006-07 2007-08 2008-09<br />
Kindergarteners who attended preschool<br />
61% 60% 61%<br />
Kindergarten teachers with Early Childhood Endorsement Certificates<br />
21% 20% 19%<br />
Source: Hawaii State Department of Education, System Evaluation & Reporting Section.<br />
Economically<br />
Disadvantaged<br />
31%<br />
No<br />
Special Needs<br />
48%<br />
Percent of Students with Special Needs<br />
2009<br />
Special Education<br />
5%<br />
English Language<br />
Learners<br />
3%<br />
Section 504<br />
1%<br />
Multiple<br />
Special Needs<br />
13%<br />
Total may not be exactly<br />
100% due to rounding.<br />
Source: Hawaii State Department of Education, System Evaluation & Reporting Section.<br />
Composite of selected annual enrollment rosters, unduplicated count.<br />
Educators<br />
<br />
2007 2008 2009<br />
Fully Licensed 86% 88% 90%<br />
Advanced Degree 29% 30% 31%<br />
5+ Yrs at the Same School 52% 53% 55%<br />
Note. These figures do not include teachers at charter schools.<br />
Source: Hawaii State Department of Education, Office of Human Resources.<br />
Based on head counts.<br />
Students <strong>and</strong> Schools<br />
Enrollment Trends<br />
Since public school enrollment peaked in 1997-98<br />
(N=189,281), the total number of students has declined to<br />
177,871 in 2008-09. This trend parallels an overall drop<br />
in the State’s population demographics for school-age<br />
children. Enrollment in private schools has been slowly<br />
rising over the last five years to represent almost 17% of<br />
the State’s students. Not since the late 1980’s has private<br />
school enrollment reached a high of 17% of the State’s total<br />
student enrollment.<br />
Hawaii State School Readiness <strong>Assessment</strong><br />
The HSSRA is a collaborative project between the Hawaii<br />
Department of Education <strong>and</strong> Good Beginnings Alliance.<br />
The HSSRA survey annually looks at schools’ readiness<br />
for incoming kindergarteners <strong>and</strong> students’ readiness<br />
for school. The HSSRA results can be a vital resource to<br />
improve services to our children. The P-3 Demonstration<br />
Projects (a part of the Hawaii P-20 Partnerships for Education)<br />
in the Farrington, Nanakuli, <strong>and</strong> Waianae Complexes<br />
is an initiative which uses the HSSRA results in its pursuit<br />
to increase children’s experiences in quality early learning<br />
programs, <strong>and</strong> also provides early childhood <strong>and</strong> elementary<br />
educators with quality professional development<br />
opportunities.<br />
Special Needs<br />
Student populations with special needs have constituted<br />
the majority of those enrolled in Hawaii public schools<br />
since 1996. In 2009, there were approximately 52% of<br />
students with special needs. The responsibility <strong>and</strong> cost<br />
of educating special needs students are challenges faced<br />
in Hawaii <strong>and</strong> nationally, particularly since “closing the<br />
achievement gap” among students has become a federal<br />
accountability goal.<br />
Educators<br />
Teacher licensure <strong>and</strong> advanced degrees, along with teachers<br />
staying five or more years at the same school, have seen<br />
gradual but consistent increases over the past three years.<br />
This trend is a positive sign of improvements in overall<br />
teacher quality <strong>and</strong> staffing stability within schools.