Educational Assessment and Accountability; Annual Reports ...
Educational Assessment and Accountability; Annual Reports ...
Educational Assessment and Accountability; Annual Reports ...

You also want an ePaper? Increase the reach of your titles
YUMPU automatically turns print PDFs into web optimized ePapers that Google loves.
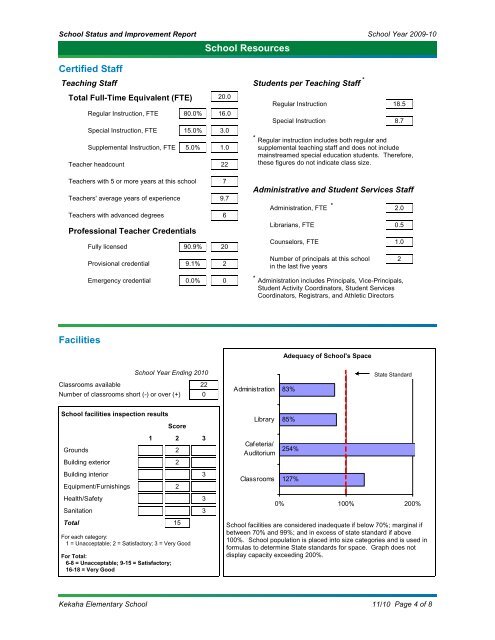
School Status <strong>and</strong> Improvement Report<br />
Certified Staff<br />
Teaching Staff<br />
Total Full-Time Equivalent (FTE)<br />
Regular Instruction, FTE<br />
Special Instruction, FTE<br />
Supplemental Instruction, FTE<br />
Teacher headcount<br />
Teachers with 5 or more years at this school<br />
Teachers' average years of experience<br />
Teachers with advanced degrees<br />
80.0%<br />
15.0%<br />
5.0%<br />
Professional Teacher Credentials<br />
Facilities<br />
Fully licensed<br />
Provisional credential<br />
Emergency credential<br />
School facilities inspection results<br />
Grounds<br />
Building exterior<br />
Building interior<br />
Equipment/Furnishings<br />
Health/Safety<br />
Sanitation<br />
90.9%<br />
9.1%<br />
0.0%<br />
School Year Ending 2010<br />
Classrooms available 22<br />
Number of classrooms short (-) or over (+) 0<br />
Score<br />
1 2 3<br />
Total 15<br />
For each category:<br />
1 = Unacceptable; 2 = Satisfactory; 3 = Very Good<br />
For Total:<br />
6-8 = Unacceptable; 9-15 = Satisfactory;<br />
16-18 = Very Good<br />
2<br />
2<br />
2<br />
3<br />
3<br />
3<br />
School Resources<br />
20.0<br />
16.0<br />
3.0<br />
1.0<br />
22<br />
7<br />
9.7<br />
6<br />
20<br />
2<br />
0<br />
*<br />
Students per Teaching Staff<br />
Regular Instruction<br />
Special Instruction<br />
School Year 2009-10<br />
Administrative <strong>and</strong> Student Services Staff<br />
Administration, FTE *<br />
Librarians, FTE<br />
Counselors, FTE<br />
Number of principals at this school<br />
in the last five years<br />
18.5<br />
8.7<br />
* Regular instruction includes both regular <strong>and</strong><br />
supplemental teaching staff <strong>and</strong> does not include<br />
mainstreamed special education students. Therefore,<br />
these figures do not indicate class size.<br />
2.0<br />
0.5<br />
1.0<br />
* Administration includes Principals, Vice-Principals,<br />
Student Activity Coordinators, Student Services<br />
Coordinators, Registrars, <strong>and</strong> Athletic Directors<br />
Administration<br />
Library<br />
Caf eteria/<br />
Auditorium<br />
Classrooms<br />
Adequacy of School's Space<br />
83%<br />
85%<br />
254%<br />
127%<br />
0% 100% 200%<br />
School facilities are considered inadequate if below 70%; marginal if<br />
between 70% <strong>and</strong> 99%; <strong>and</strong> in excess of state st<strong>and</strong>ard if above<br />
100%. School population is placed into size categories <strong>and</strong> is used in<br />
formulas to determine State st<strong>and</strong>ards for space. Graph does not<br />
display capacity exceeding 200%.<br />
2<br />
State St<strong>and</strong>ard<br />
Kekaha Elementary School 11/10<br />
Page 4 of 8