Educational Assessment and Accountability; Annual Reports ...
Educational Assessment and Accountability; Annual Reports ...
Educational Assessment and Accountability; Annual Reports ...

Create successful ePaper yourself
Turn your PDF publications into a flip-book with our unique Google optimized e-Paper software.
8 2009 SuperintenDent’S <strong>Annual</strong> Report<br />
aT-a-GlanCe<br />
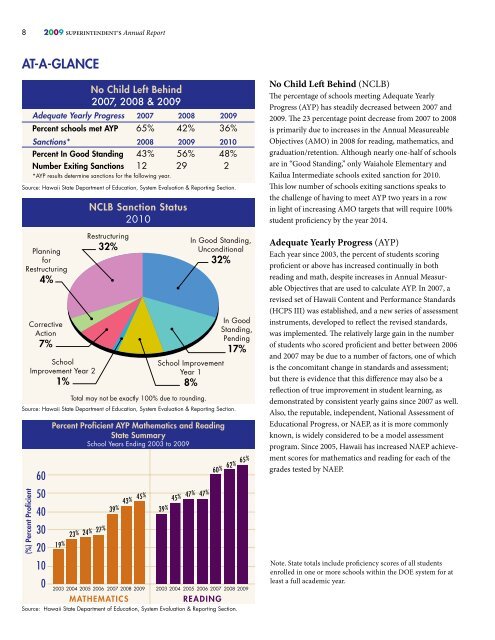
Planning<br />
for<br />
Restructuring<br />
4%<br />
(%) Percent Proficient<br />
Corrective<br />
Action<br />
7%<br />
School<br />
Improvement Year 2<br />
1%<br />
60<br />
50<br />
40<br />
30<br />
20<br />
10<br />
0<br />
Percent Proficient AYP Mathematics <strong>and</strong> Reading<br />
State Summary<br />
School Years Ending 2003 to 2009<br />
19 %<br />
23 % 24 % 27 %<br />
No Child Left Behind<br />
<br />
Adequate Yearly Progress 2007 2008 2009<br />
Percent schools met AYP 65% 42% 36%<br />
Sanctions* 2008 2009 2010<br />
Percent In Good St<strong>and</strong>ing 43% 56% 48%<br />
Number Exiting Sanctions 12 29 2<br />
*AYP results determine sanctions for the following year.<br />
Source: Hawaii State Department of Education, System Evaluation & Reporting Section.<br />
NCLB Sanction Status<br />
2010<br />
Restructuring<br />
32%<br />
39 %<br />
43 % 45 %<br />
2003 2004 2005 2006 2007 2008 2009<br />
MATHEMATICS<br />
School Improvement<br />
Year 1<br />
8%<br />
Total may not be exactly 100% due to rounding.<br />
Source: Hawaii State Department of Education, System Evaluation & Reporting Section.<br />
39 %<br />
45 % 47 % 47 %<br />
In Good St<strong>and</strong>ing,<br />
Unconditional<br />
32%<br />
Source: Hawaii State Department of Education, System Evaluation & Reporting Section.<br />
60 %<br />
2003 2004 2005 2006 2007 2008 2009<br />
READING<br />
In Good<br />
St<strong>and</strong>ing,<br />
Pending<br />
17%<br />
62 %<br />
65 %<br />
No Child Left Behind (NCLB)<br />
The percentage of schools meeting Adequate Yearly<br />
Progress (AYP) has steadily decreased between 2007 <strong>and</strong><br />
2009. The 23 percentage point decrease from 2007 to 2008<br />
is primarily due to increases in the <strong>Annual</strong> Measureable<br />
Objectives (AMO) in 2008 for reading, mathematics, <strong>and</strong><br />
graduation/retention. Although nearly one-half of schools<br />
are in “Good St<strong>and</strong>ing,” only Waiahole Elementary <strong>and</strong><br />
Kailua Intermediate schools exited sanction for 2010.<br />
This low number of schools exiting sanctions speaks to<br />
the challenge of having to meet AYP two years in a row<br />
in light of increasing AMO targets that will require 100%<br />
student proficiency by the year 2014.<br />
Adequate Yearly Progress (AYP)<br />
Each year since 2003, the percent of students scoring<br />
proficient or above has increased continually in both<br />
reading <strong>and</strong> math, despite increases in <strong>Annual</strong> Measurable<br />
Objectives that are used to calculate AYP. In 2007, a<br />
revised set of Hawaii Content <strong>and</strong> Performance St<strong>and</strong>ards<br />
(HCPS III) was established, <strong>and</strong> a new series of assessment<br />
instruments, developed to reflect the revised st<strong>and</strong>ards,<br />
was implemented. The relatively large gain in the number<br />
of students who scored proficient <strong>and</strong> better between 2006<br />
<strong>and</strong> 2007 may be due to a number of factors, one of which<br />
is the concomitant change in st<strong>and</strong>ards <strong>and</strong> assessment;<br />
but there is evidence that this difference may also be a<br />
reflection of true improvement in student learning, as<br />
demonstrated by consistent yearly gains since 2007 as well.<br />
Also, the reputable, independent, National <strong>Assessment</strong> of<br />
<strong>Educational</strong> Progress, or NAEP, as it is more commonly<br />
known, is widely considered to be a model assessment<br />
program. Since 2005, Hawaii has increased NAEP achievement<br />
scores for mathematics <strong>and</strong> reading for each of the<br />
grades tested by NAEP.<br />
Note. State totals include proficiency scores of all students<br />
enrolled in one or more schools within the DOE system for at<br />
least a full academic year.