Educational Assessment and Accountability; Annual Reports ...
Educational Assessment and Accountability; Annual Reports ...
Educational Assessment and Accountability; Annual Reports ...

Create successful ePaper yourself
Turn your PDF publications into a flip-book with our unique Google optimized e-Paper software.
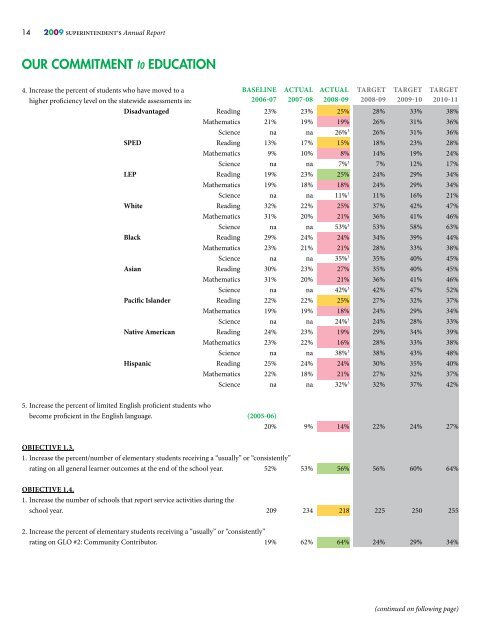
14 2009 SuperintenDent’S <strong>Annual</strong> Report<br />
oUr CoMMITMenT to eDUCaTIon<br />
4. Increase the percent of students who have moved to a<br />
higher proficiency level on the statewide assessments in:<br />
BASELINE ACTUAL ACTUAL TARGET TARGET TARGET<br />
2006-07 2007-08 2008-09 2008-09 2009-10 2010-11<br />
Disadvantaged Reading 23% 23% 25% 28% 33% 38%<br />
Mathematics 21% 19% 19% 26% 31% 36%<br />
Science na na 26% 3 26% 31% 36%<br />
SPED Reading 13% 17% 15% 18% 23% 28%<br />
Mathematics 9% 10% 8% 14% 19% 24%<br />
Science na na 7% 3 7% 12% 17%<br />
LEP Reading 19% 23% 25% 24% 29% 34%<br />
Mathematics 19% 18% 18% 24% 29% 34%<br />
Science na na 11% 3 11% 16% 21%<br />
White Reading 32% 22% 25% 37% 42% 47%<br />
Mathematics 31% 20% 21% 36% 41% 46%<br />
Science na na 53% 3 53% 58% 63%<br />
Black Reading 29% 24% 24% 34% 39% 44%<br />
Mathematics 23% 21% 21% 28% 33% 38%<br />
Science na na 35% 3 35% 40% 45%<br />
Asian Reading 30% 23% 27% 35% 40% 45%<br />
Mathematics 31% 20% 21% 36% 41% 46%<br />
Science na na 42% 3 42% 47% 52%<br />
Pacific Isl<strong>and</strong>er Reading 22% 22% 25% 27% 32% 37%<br />
Mathematics 19% 19% 18% 24% 29% 34%<br />
Science na na 24% 3 24% 28% 33%<br />
Native American Reading 24% 23% 19% 29% 34% 39%<br />
Mathematics 23% 22% 16% 28% 33% 38%<br />
Science na na 38% 3 38% 43% 48%<br />
Hispanic Reading 25% 24% 24% 30% 35% 40%<br />
Mathematics 22% 18% 21% 27% 32% 37%<br />
Science na na 32% 3 32% 37% 42%<br />
5. Increase the percent of limited English proficient students who<br />
become proficient in the English language. (2005-06)<br />
20% 9% 14% 22% 24% 27%<br />
OBjECTIvE 1.3.<br />
1. Increase the percent/number of elementary students receiving a “usually” or “consistently”<br />
rating on all general learner outcomes at the end of the school year. 52% 53% 56% 56% 60% 64%<br />
OBjECTIvE 1.4.<br />
1. Increase the number of schools that report service activities during the<br />
school year. 209 234 218 225 250 255<br />
2. Increase the percent of elementary students receiving a “usually” or “consistently”<br />
rating on GLO #2: Community Contributor. 19% 62% 64% 24% 29% 34%<br />
(continued on following page)